WO2004051868A2 - Server and multiple sensor system for monitoring activity in a shared radio frequency band - Google Patents

Server and multiple sensor system for monitoring activity in a shared radio frequency band Download PDF

Info

Publication number
WO2004051868A2
WO2004051868A2 PCT/US2003/036866 US0336866W WO2004051868A2 WO 2004051868 A2 WO2004051868 A2 WO 2004051868A2 US 0336866 W US0336866 W US 0336866W WO 2004051868 A2 WO2004051868 A2 WO 2004051868A2
Authority
WO
WIPO (PCT)
Prior art keywords
radio
frequency band
wireless network
server
data
Prior art date
Application number
PCT/US2003/036866
Other languages
French (fr)
Other versions
WO2004051868A3 (en
Inventor
Neil R. Diener
David S. Kloper
Anthony T. Collins
Original Assignee
Cognio, Inc.
Priority date (The priority date is an assumption and is not a legal conclusion. Google has not performed a legal analysis and makes no representation as to the accuracy of the date listed.)
Filing date
Publication date
Priority claimed from US10/409,563 external-priority patent/US20050003828A1/en
Priority claimed from US10/420,515 external-priority patent/US7424268B2/en
Application filed by Cognio, Inc. filed Critical Cognio, Inc.
Priority to AU2003291065A priority Critical patent/AU2003291065A1/en
Publication of WO2004051868A2 publication Critical patent/WO2004051868A2/en
Publication of WO2004051868A3 publication Critical patent/WO2004051868A3/en

Links

Classifications

    • HELECTRICITY
    • H04ELECTRIC COMMUNICATION TECHNIQUE
    • H04WWIRELESS COMMUNICATION NETWORKS
    • H04W24/00Supervisory, monitoring or testing arrangements
    • HELECTRICITY
    • H04ELECTRIC COMMUNICATION TECHNIQUE
    • H04WWIRELESS COMMUNICATION NETWORKS
    • H04W24/00Supervisory, monitoring or testing arrangements
    • H04W24/08Testing, supervising or monitoring using real traffic

Definitions

  • SAGE real-time spectrum analysis engine
  • the present invention relates to a system and method for managing a shared frequency band using a plurality of sensors positioned to capture information concerning activity in the shared frequency band.
  • a frequency hopping signal e.g., a signal emitted from a device that uses the BluetoothTM communication protocol or a signal emitted from certain cordless phones
  • WLAN wireless local area network
  • WLANs wireless networks
  • WLANs can complicate existing network management schemes because they introduce the additional requirement of efficiently managing radio spectrum.
  • Current WLAN systems and management technology are focused on managing activity at the network level of the WLAN, but provide little or no capability to manage the frequency band where signals of multiple types (e.g., communication protocol/network types, device types, etc.) are present.
  • an intelligent spectrum management (ISM) system and method includes sophisticated features to detect, classify, and locate sources of RF activity.
  • the system comprises one or more radio sensor devices positioned at various locations in a region where activity in a shared radio frequency band is occurring.
  • a server is coupled to the radio sensor devices and aggregates the data generated by the sensor devices.
  • Each radio sensor device comprises a spectrum monitoring section and a traffic monitoring section.
  • the spectrum monitoring section comprises a radio receiver capable of receiving radio signals in a radio frequency band, a spectrum analysis system coupled to the radio receiver for generating spectrum (radio frequency) activity information representative of the (radio frequency) activity in the frequency band.
  • the traffic monitoring section comprises a baseband signal processing section that demodulates signals transmitted by other devices on a wireless network in the frequency band according to the communication protocol and a radio receiver coupled to the baseband signal processing section that receives signals on the wireless network and couples received signals to the baseband signal processing section.
  • a processor is coupled to the spectrum monitoring section and to the traffic monitoring section. The processor executes one or more programs to analyze packets transmitted by devices on the wireless network in the frequency band based on signals demodulated by the baseband signal processing section and to classify radio signals occurring in the frequency band based on the spectrum activity information output by the spectrum analysis system.
  • the server receives data from each of the plurality of sensor devices and executes functions to process the data. For example, the server executes a performance function that monitors and generates events related to the performance of the wireless network, a discovery function that monitors and generates events pertaining to devices operating in the wireless network or other radio frequency emitters in the frequency band and a security function that monitors and generates events related to security threats to the wireless network.
  • the server interfaces data generated by its various functions to a client application, e.g., a network management application.
  • the server is configurable by a network management application through an application programming interface (API) with respect to the type of information requested about activity in the wireless network and/or frequency band, and the server supplies aggregated data from the plurality of radio sensors to the network management application through the API.
  • API application programming interface
  • FIG. 1 is a block diagram of a spectrum management sensor system.
  • FIG. 2 is a block diagram of a sensor.
  • FIGs. 3 and 4 are functional block diagrams of the server and a sensor.
  • FIG. 5 is a software block diagram of a sensor.
  • FIG. 6 is a software block diagram of the server.
  • FIGs. 7 and 8 are ladder diagrams of two exemplary processes that may be executed by the system.
  • FIG. 9 is a diagram showing how pluralities of sensors are deployed in an office environment in which WLAN and other activity is occurring.
  • FIG. 10 is a diagram showing a launcher bar of a console graphical user interface client application.
  • FIGs. 11-17 show various console application display screens that display data generated by the server.
  • the system, methods, software and other technologies described herein are designed to cooperatively manage use of a shared frequency band where signals of multiple types occur (often simultaneously), such as an unlicensed band, and interference among the users of the band may occur.
  • signals of multiple types occur (often simultaneously)
  • unlicensed band a shared frequency band where signals of multiple types occur (often simultaneously), such as an unlicensed band, and interference among the users of the band may occur.
  • Many of the concepts described herein may apply to frequency bands that are not necessarily "unlicensed,” such as when a licensed frequency band is used for secondary licensed or unlicensed purposes.
  • network is used hereinafter in many ways.
  • One example of such a network is a WLAN.
  • piconets which are formed with BluetoothTM capable devices.
  • Many of the examples described herein are made with respect to an IEEE 802.11 (also known as WiFiTM) WLAN, mostly due in part to the expansive use that the WLAN has seen, and is expected to continue to see.
  • IEEE 802.11 also known as WiFiTM
  • the term network is referred to a wired network, and to an aggregation of one or more wired and wireless networks.
  • the spectrum management systems, methods, software and device features described herein new are not limited to any particular wireless network, and are equally applicable to any wireless network technologies now known or hereinafter developed for use in a shared frequency band.
  • FIG. 1 an environment is shown where there are multiple devices that at some point in their modes of operation transmit or emit signals within a common frequency band, and that may at least partially overlap in frequency and time. When these devices are sufficiently close in proximity to each other, or transmit signals at sufficiently high power levels, there will inevitably be interference between signals of one or more devices.
  • the dotted- line shown in FIG. 1 is meant to indicate a region where activity from any of the devices shown may impact other devices.
  • a region may be a building in which there are multiple zones of unlicensed band activity. The concept of zones is described further hereinafter.
  • WLAN wireless local area network
  • STAs client station
  • infant monitor devices 1060 infant monitor devices 1060 as well as any other existing or new wireless devices 1070.
  • Multiple WLAN APs 1050(1) to 1050(N) may be operating in the region, each of which has one or more associated client STAs 1030(1) to 1030(N).
  • One or more of the WLAN APs 1050(1) to 1050(N) may be connected to a wired network (e.g., Ethernet network) to which also connected is a server 1055.
  • Cordless phones 1000 may be analog, digital and frequency hopping devices, depending on the type.
  • Frequency hopping communication devices 1010 may include devices operating in accordance with the BluetoothTM wireless communication protocol, the HomeRFTM wireless communication protocol, as well as cordless phones.
  • radar devices 1080 may operate in an unlicensed frequency band. Other devices that may operate in the frequency band may also include appliances such as digital (still and/or) video cameras, cable-set top boxes, etc.
  • the spectrum management system described herein involves deployment of a plurality of sensors 2000(1) to 2000(N) shown in FIG. 1 in various locations or zones where activity associated with any of the plurality of signal types is occurring in the frequency band to form a sensor overlay network.
  • the spectrum and protocol intelligence gathered by the spectrum sensors is fed to a server 3000.
  • a super server 7000 may connect to the plurality of servers 3000(1) to 3000(P) to manage each of the servers.
  • a single server 3000 (corresponding to server 3000(1)) will be referred to in the following description.
  • the server 3000 contains the aggregation and analysis software which processes low-level spectrum and protocol data from the sensors 2000(1) to 2000(N) and provides network level services described hereinafter.
  • the sensors 2000(1) to 2000(N) are referred to as "agents" to the server 3000.
  • a network management station 4000 executes one or more end-user client management applications 4005 or contains network management server software that requests services from the server.
  • the network management station 4000 may include one or more processors 4100, memory 4200 and a display 4300.
  • An example of an end-user management application is one that provides a console graphical user interface (GUI) to network engineers or IT managers.
  • GUI console graphical user interface
  • WLAN management functions such as (1) AP configuration, AP firmware upgrades, etc.; (2) security management such as authentication or virtual private network (VPN) management; and (3) management of other networks, such as a wired Ethernet network.
  • the network management station 4000 is referred to as a "client" to the server 3000.
  • the network management station 4000 may e part of a larger WLAN management infrastructure including servers and switches, which in turn, interfaces with a generalized (wired and wireless) network management infrastructure.
  • each sensor 2000(i) comprises a spectrum monitoring 2100 section to monitor RF activity in the frequency band and a traffic monitoring section 2500 that is capable of sending and receiving traffic according to a communication protocol, such as an IEEE 802.11 WLAN protocol.
  • the spectrum monitoring section 2100 comprises a radio 2110 (primarily for receive operations) that is capable of tuning to receive energy at each channel (or simultaneously all channels in a wideband mode) of, for example, any of the unlicensed bands (2.4 GHz and 5 GHz) in which IEEE 802.11 WLANs operate.
  • An analog-to-digital converter (ADC) 2112 is coupled to the radio 2100 that converts the downconverted signals from the radio 2100 to digital signals.
  • ADC analog-to-digital converter
  • a radio interface (I/F) 2120 is coupled directly to the radio 2100 and also to the output of the ADC 2112.
  • a spectrum analysis engine (SAGE) 2130 is coupled to the radio I/F 2120.
  • the SAGE 2130 is thoroughly described in the aforementioned co- pending and commonly assigned patent applications, and includes a spectrum analyzer 2132, a signal detector 2134 consisting of a peak detector 2136 and one or more pulse detectors 2138, and a snapshot buffer 2140.
  • a Fast Fourier Transform (FFT) block (not shown) is coupled between the I/F 2120 and the spectrum analyzer 2132, or included in the spectrum analyzer 2132.
  • FFT Fast Fourier Transform
  • the SAGE 2130 generates spectrum activity information that is used in the sensor and the server to determine the types of signals occurring in the frequency band, and captures signals for location measurement operations.
  • a dual port random access memory (RAM) 2150 is coupled to receive the output of the SAGE 2130 and a processor I/F 2160 interfaces data output by the SAGE 2130 to a processor 2700, and couples configuration information from the processor 2700 to the SAGE 2130.
  • the functions of the SAGE 2130 will be briefly described in further detail hereinafter.
  • the spectrum analyzer 2132 generates data representing a real-time spectrogram of a bandwidth of radio frequency (RF) spectrum, such as, for example, up to 100 MHz.
  • RF radio frequency
  • the spectrum analyzer 2132 may be used to monitor all activity in a frequency band, for example, the 2.4-2.483 GHz ISM band, or the 5.15-5.35 GHz and 5.725-5.825 GHz UNII bands.
  • the FFT block referred to above is, for example, a 256 frequency bin FFT block that provides (I and Q) FFT data for each of 256 frequency bins that span the bandwidth of frequency band of interest.
  • a spectrum correction block may be included to correct for I and Q channel imbalance by estimating an I-Q channel imbalance parameter related to phase error and amplitude offset between the I and Q channels, and to suppress a side tone resulting from the RF downconversion process.
  • the spectrum analyzer 2132 may further comprise a power computation block that computes (FFTdataI)2 and (FFTdataQ)2, respectively, and adds them together, to output a power value for each FFT frequency bin.
  • the spectrum analyzer 2132 may further include a stats logic block that has logic to accumulate statistics for power, duty cycle, maximum power and a peaks histogram. Statistics are accumulated in the dual-port RAM over successive FFT time intervals. After a certain number of FFT intervals, determined by a configurable value stored in the spectrum analyzer control registers, an interrupt is generated to output the stats from the dual-port RAM. For example, the stats are maintained in the dual-port RAM 2150 for 10,000 FFT intervals before the processor reads out the values.
  • the power versus frequency data generated by the spectrum analyzer 2132 is also used as input to the signal detector.
  • the signal detector 2134 detects signal pulses in the frequency band and outputs pulse event information entries, which include one or more of the start time, duration, power, center frequency and bandwidth of each pulse that satisfies configurable pulse characteristic criteria associated with a corresponding pulse detector.
  • the peak detector 2136 looks for spectral peaks in the (power versus frequency data derived from FFT block output), and reports the bandwidth, center frequency and power for each detected peak.
  • the output of the peak detector 2136 is one or more peaks and related information.
  • the pulse detectors 2138 detect and characterize signal pulses based on input from the peak detector 2136.
  • the snapshot buffer 2140 collects a set of raw digital signal samples useful for signal classification and other purposes, such as time of arrival location measurements.
  • the snapshot buffer 2140 can be triggered to begin sample collection from either the signal detector 2134 or from an external trigger source.
  • the snapshot buffer 2140 can be triggered to begin sample collection from either the signal detector 2134 or from an external trigger source, such as a signal from the processor to capture received signal data for a period of time sufficient to include a series of signal exchanges used for location processing explained hereinafter.
  • the snapshot buffer will be in a free-running state continuously storing captured and then in response to detecting the first signal (e.g., the Probe Request frame), the snapshot buffer is put into a post-store mode that extends long enough to capture the ACK frame signal data.
  • the traffic monitoring section 2500 monitors packet activity in wireless network, e.g., a WLAN, and sends and receives certain packets that are used for location measurement processes. For example, as described hereinafter, a sensor may transmit an 802.11 Probe Request frame, data frame or request-to-send frame that may be addressed to the device to be located. Included in the traffic monitoring section 2500 are a radio transceiver 2510 (comprising a transmitter Tx and a receiver Rx) and a baseband signal processor 2520. The radio transceiver 2510 and baseband signal processor 2520 may be part of a package chipset available on the market today, such as an 802.11 WLAN chipset for any one or more of the 802.1 la/b/g or other WLAN communication standards.
  • the baseband signal processor 2520 is capable of performing the baseband modulation, demodulation and other PHY layer functions compliant with the one or more communication standards of interest (e.g., IEEE 802.1 la,b,g,h, etc.).
  • An I/F 2530 couples the baseband signal processor 2520 and radio transceiver 2510 to the processor 2700.
  • the processor 2700 performs the various processing algorithms described herein on the output of the SAGE 2130 and on received packets from the traffic monitoring section 2500.
  • the processor I/F 2160 of the spectrum monitoring section 2100 and the processor I/F 2530 of traffic monitoring section 2500 may be a Mini-PCI or PC-Card (e.g., CardbusTM) interface, or any other interface known in the art.
  • LAN interface block e.g., Ethernet
  • the processor 2700 may generate signals to control the radio 2110 independently of the radio transceiver 2510, such that spectrum monitoring is occurring on one channel while protocol monitoring is simultaneously occurring on another channel, for example.
  • a WLAN AP may include all of the functionality of a sensor described above, and may be switched between AP operating mode and a sensor operating mode.
  • FIG. 3 a high level diagram is shown of the major functional blocks in the sensor 2000 and server 3000, as well as the interfaces between the sensor 2000 and server 3000, and between client applications 405 and the server 3000.
  • the processor executing one or more software programs
  • the measurement engine 2710 and classification engine 2720 operate on RF data from the SAGE 2130.
  • the location engine 2730 operates on raw received signal data obtained by the SAGE 2130 and the protocol engine 2740 operates on packet data generated by the baseband signal processor 2520.
  • the interface between the sensor 2000 and the server 3000 is referred to as a network spectrum interface (NSI) 2900.
  • NSI network spectrum interface
  • the server 3000 may run on a dedicated server box, or it may be integrated with other servers such as WLAN switches, authentication servers or management servers.
  • the server consist primarily of an application that implements several services or functions described hereinafter.
  • the high level services 3100 include a database 3110, discovery manager 3120, performance manager 3130 and security manager 3140.
  • the low level services 3200 are invoked by one or more or the high level services 3100 and include an RF manager 3210, location manager 3220 and protocol manager 3230.
  • the interface services 3300 include an SNMP agent 3310, a Syslog interface 3320 and a web interface 3300.
  • the server 3000 interfaces with the client applications 4005 by an application programming interface (API) called the intelligent spectrum management interface (ISMI) 3900.
  • API application programming interface
  • ISMI intelligent spectrum management interface
  • the server manages all of the sensors it communicates with. It aggregates data from the sensors, performs analysis on the data and presents the data in formats amenable to other network management entities.
  • the server software analyzes the raw data primarily on three axes:
  • Performance Analyze the spectrum, protocol, and location data in order to detect and mitigate performance problems. Examples include network load problems, frequency retransmissions, interference and cold spots.
  • Security Analyze the spectrum, protocol, and location data in order to detect and mitigate security issues. Examples include rogue APs, ad hoc networks, perimeter breaches, denial of service attacks (protocol and RF level) and movement of otherwise designated stationary assets.
  • FIG. 4 illustrates the interaction between the server and the sensor in more detail, and the function of each of these blocks is described hereinafter. It should be understood that while only one sensor and one server are shown, a server 3000 communicates and aggregates data from one or several sensors 2000(1) to 2000(N).
  • the processor in the sensor also executes a station manager 2750 and an agent NSI 2760.
  • the measurement engine 2710 software in the sensor is responsible for communicating with the SAGE driver software to configure the SAGE 2130 in the sensor 2000.
  • the measurement engine 2710 manages the resources of the SAGE 2130 between spectrum monitoring functions and device location functions.
  • the measurement engine 2710 also collects and aggregates data from the SAGE 2130 into meaningful units.
  • the functions of the measurement engine 2710 and classification engine 2720 may be incorporated into a single functional block.
  • the measurement engine 2710 may configure reporting of data and statistics generated by the SAGE 2130 and adjust the frequency channel (and/or scan rate) on which the SAGE 2130 operates.
  • the measurement engine 2710 may also operate the radio receiver in the sensor in a wideband mode to simultaneously process data across an entire unlicensed frequency band of interest.
  • the classification engine 2720 classifies/identifies signals occurring in the frequency based on the output of the SAGE 2130. Examples of signals that the classification engine 2720 may identify include BluetoothTM signals, microwave oven signals, cordless telephones, wireless headsets, radar, etc. Techniques for signal classification are described in greater detail in the aforementioned commonly assigned and co-pending U.S. Patent Applications.
  • the classification engine 2720 may generate events (at a configurable update rate) associated with identified signals and may further make a generalized "air quality analysis" of the frequency band given the type of signals determined to be occurring in the frequency band. Examples of the statistics and events output by the measurement engine 2710 and classification engine 2720 are described hereinafter.
  • the location engine 2730 in the sensor is responsible for capturing raw received signal data used for time difference of arrival (TDOA) computations at the sensor.
  • the location engine 2730 makes the TDOA computations and sends those computations to the server 3000 where the location computation is made based on multiple TDOA computations for a location process.
  • the location engine 2730 negotiates access to the snapshot buffer of the SAGE (to capture raw received signal data) by sending a request to the measurement engine 2710.
  • the location engine 2730 initiates a location function in response to a Location Request (Loc Req) message from the server, and responds with the TDOA data in a Location Response (Loc Resp) message to the server. This process is described in more detail hereinafter.
  • the protocol engine 2740 captures information pertaining to packets transmitted over the air in accordance with a communication protocol, such as the IEEE 802.11 protocols.
  • the baseband signal processor section of the sensor 2000 may operate in a "promiscuous mode" by which it can receive packets sent by any device on a particular 802.11 channel (but may not have access to the content of packets). In this manner, the sensor can develop statistics about the type of packets being sent, the volume of packet traffic, packet retransmissions, intruding APs or STAs, etc.
  • the protocol engine 2740 collects statistics on the packet on a per channel, per device or per BSSID basis.
  • the protocol engine 2740 is responsive to a service configuration (Config) message from the server to configure how to capture and report protocol information.
  • Config service configuration
  • the protocol engine 2740 performs functions to support location determination of other devices, such as scheduling the transmission of a reference packet that is used in TDOA location computations.
  • the protocol engine 2740 configures the process by which the sensor scans 802.11 channels to obtain packet information.
  • the channel scan parameters may include channel selection, dwell time on the channel, hop pattern between channels, measurement intervals, etc.
  • the protocol engine 2740 configures criteria for protocol-based asynchronous alerts associated with network performance or security, or sensor operational conditions according to corresponding threshold based alarm criteria. Examples of techniques useful for protocol-based intrusion detection and address spoofing are described in the paper entitled “Layer 2 Analysis of WLAN Discovery Applications for Intrusion Detection,” Joshua Wright, November 18, 2002, and in the paper entitled “Detecting Wireless LAN MAC Address Spoofing,” Joshua Wright, January 21, 2003. These papers are available from the Internet using a suitable search engine, and their entirety is incorporated herein by reference.
  • the station manager 2750 software is responsible for storage and self- testing functions of the sensor. Specifically, the station manager provides persistent storage on a non- volatile memory of information pertaining to the individual sensor, including IP configuration, security keys used to authenticate the sensors to the server and vice-versa, sensor calibration data, software download information, and software version information.
  • the station manager 2750 also executes self-tests that are run when the sensor is powered on. Examples of functions or features that are tested include memory, chip detection, register read/write, LEDs, chip reset, interrupt tests and other board and chip level tests.
  • the agent NSI software 2780 manages the interface responsibilities for the sensor. It parses NSI messages received from the server to translate them into controls for one or more functions of the sensor, and generates messages containing data from one or more functions of the sensor. In addition, the agent NSI registers and de-registers software tasks for communication. A registering task can specify an interest in receiving events and from which sensor. Finally, the agent NSI supports the use of fixed compile time keys for authentication, or other more sophisticated security schemes.
  • FIG. 5 shows other software blocks in the sensor 2000. An 802.11 user mode driver 2760 and an 802.11 device driver 2762 communicate with the traffic monitoring section of the sensor 2000.
  • the drivers referred to herein may sit on an embedded operating system (OS) 2780.
  • OS operating system
  • Ethernet driver not shown
  • OS 2780 to support wired LAN connectivity, there is an Ethernet driver (not shown) that sits on the OS 2780 in a similar manner to the 802.11 drivers.
  • the Server Software Similar to the agent NSI software, there is server NSI software 3250 in the server 3000 that is responsible for sending and receiving NSI messages, registering and de-registering software tasks including specifying which sensors the server is interested in receiving event information from as well as security support.
  • the server NSI 3250 supports sensor management by notifying the sensor manager 3180 about the availability of sensors and the status of those sensors, e.g., sensor up/down type information.
  • the server NSI 3250 also handles transport and socket management, and tasks related to setting up or tearing down the transport pipes, which may be socket-based.
  • the server NSI 3250 supports requests from other server software (e.g. sensor manager) to open or close a connection to a sensor.
  • the server NSI 3250 also processes a TCP connection, coming up or going down.
  • the other server manager software functions that have registered to receive it are notified of this event.
  • the down event may also be inferred from logic associated with activity over the transport pipe.
  • the server NSI also configures discovery parameters for sensors (MAC address, port and interval).
  • the higher level services 3100 of the server 3000 will now be described.
  • the database 3110 provides physical storage of spectrum information, events, protocol information and related information generated by the sensors.
  • the database 3110 maintains configuration information pertaining to the functions in the server 3000 and many functions in the sensors.
  • a database schema is defined for the storage of this information, and is described hereinafter.
  • the discovery manager 3120 in the server processes data pertaining to the discovery of new devices operating in the frequency band, such as 802.11 and other devices, and the physical location of those devices. Discovery involves handling reports from sensors concerning the up (and new) and down state of such devices. Also, multiple sensors may see the same 802.11 device coming up. The discovery manager 3120 detects suppresses the duplicate event. A discovery event associated with an 802.11 device may fall into one of the following classes: ours, known others, new and rogue. To this end, the discovery manager 3120 may maintain a list of authorized APs and STAs so that when a new device is detected by a sensor, the discovery manager 3120 can determine whether or not it is authorized.
  • the security manager could be the software process that maintains the list of authorized devices and determines the status of newly discovered devices.
  • the discovery manager 3120 also processes data pertaining to known and unknown interferers and handles associated events including up, down, new, and duplicate suppression.
  • the sensors report on new known and unknown interferer devices. Also, multiple sensors may see the same known and unknown interferer device coming up and the discovery manager suppresses the duplicate event.
  • the discovery manager 3120 executes a scan policy. When a new device is discovered and is in the management domain of the server, a request is made to the location manager 3220 to determine the location of the device.
  • the discovery manager 3120 handles event-action association. Given an event (e.g., when a new AP comes up), the discovery manager 3120 initiates one or a series of actions (i.e., check whether the server should manage that device, and if so, locate it, etc.).
  • the performance manager 3130 manages performance issues concerning the operation of wireless networks under the domain of the server in the shared frequency band.
  • One such function is called an "air quality" analysis.
  • the performance manager Based on the air/spectrum quality reports that the server receives from the sensors (as described above), the performance manager generates an air quality analysis that may indicate to the user overall network and spectrum air quality.
  • the air quality rating is an index that is calculated based on the average level of RF energy in a channel, number of frequency hopper signals present, and other factors. The presence and strength of frequency hopping signals in the channel is given significant weight on the overall quality measure of the channel.
  • An air quality report may consist of:
  • An aggregate index of the RF air quality in this channel For example, 0 may be the best, 100 is the worst. Values 0 - 33 indicates "EXCELLENT", 34 - 66 indicates "GOOD” and 67 - 100 indicates POOR.
  • the performance manager 3130 also sets a variety of thresholds which, if crossed, generates alarms. For example, an alarm may be generated if an AP has too many associated STAs, etc. The threshold cross alarms are described further hereinafter.
  • the security manager 3140 in the server is responsible for managing security of one or more wireless networks operating in the frequency band under its domain.
  • One type of security function is rogue AP detection.
  • rogue AP detection a user can specify which APs are inside a security perimeter of the server and are authorized to operate in that security perimeter based on IP or MAC address. Sensors report the APs and STAs that they detect. The security manager 3140 processes these reports and determines whether an AP that is not authorized to operate inside the security perimeter has been detected. If so, then the security manager 3140 generates an alarm indicating the presence of a rogue AP. A sensor detects the presence of an AP. The security manager 3140 has the responsibility to declare the detected AP a rogue.
  • a client user can specify the parameters of the security perimeter.
  • the security manager 3140 configures the security perimeter accordingly, which may be a polygon or volume region specified by the user. Inside this perimeter are the devices that the user wants to protect.
  • the security manager 3140 may generate an alert when a device physically located outside the security perimeter accesses a WLAN that is located inside the security perimeter.
  • the security manager 3140 may generate an alert when a device physically located inside the security perimeter accesses or sends data to a device outside the security perimeter or associates with an AP outside the security perimeter.
  • a client user can give a particular device operating within the domain of the server a "fixed location attribute.” The security manager 3140 detects whenever that "fixed location” device moves and reports it or generates an alert.
  • the security manager 3140 may also use trend information to detect "suspicious" protocol usage.
  • a sequence of packets that meets certain filter characteristics might be deemed to be suspicious. For example, suspicious activity may be alerted when a sensor detects repeated attempts to associate with an AP using different MAC addresses.
  • something more subtle that may be deemed suspicious is if a sensor detects packets from a particular STA that have non-sequential sequence numbers, potentially suggestive that a device user is masquerading as a particular STA.
  • Another example is a probe packet that matches a signature of a well-known piece of hacker software such as NetStumbler. These types of activities need to be monitored at the sensor, since it requires examination of detailed packet traces.
  • the security manager 3140 responds to suspicious protocol activity reports sent by sensors.
  • the low level services 3100 will now be described in more detail.
  • the RF manager 3210 is responsible for aggregating and logging signal classification events from the classification engine 2720 in a sensor 2000, and for aggregating and logging spectrum statistics and raw spectrum information from the measurement engine 2710.
  • the RF manager 3210 may also supply new or update existing classification templates or reference files to each sensor that the classification engine uses to classify RF signals.
  • the location manager 3220 in the server handles the location processing to determine a location of a device operating in the frequency band.
  • Location of a device can be a driving point for other analysis, particularly, security analysis.
  • the location manager 3220 selects a group of sensors (e.g., 4 sensors) for a location measurement operation to locate a particular device. Each location operation usually needs several sensors working in concert.
  • the location manager 3220 selects the subset sensors to be used in a location operation. Also, one of the sensors needs to be made a master, called the master reference terminal (MRT) sensor that transmits the reference signal used to solicit a response signal (second signal) from the device to be located or otherwise used as a reference with respect to the second signal transmitted by the device to be located.
  • MRT master reference terminal
  • the other sensors simply called reference terminals (RTs).
  • RTs reference terminals
  • the location manager 3220 dispatches location request messages to each of the sensors that are to be part of the location operation, and indicates in the message which sensor is the MRT.
  • Each sensor generates TDOA information with respect to their respective receipt of the first and second signals and sends this information in a Loc Resp message to the location manager 3220.
  • the location manager 3220 performs the final calculations from the TDOA information to compute the location of the device that is the subject of the location request.
  • the location manager 3220 may have a configurable retry policy for a failed location operation. Location information may be generated in 2-dimensions or 3-dimensions, and displayed in either format as well.
  • the location manager 3220 also manages the scheduling of location requests, including the priority and the number of location requests that can be handled simultaneously. Any one sensor may be capable of handling a maximum number of location requests simultaneously. It may be desirable to assign priorities to a location request on a first come, first serve, or other basis.
  • the location manager 3220 caches location information and for example, indicates a "current as of x" type information associated with a computed location. Location information has a certain life span. The location manager 3220 may keep it current for a configurable period of time and then it is aged out and replaced with new location information.
  • the location manager 3220 may periodically execute a location process with certain sensors to determine the location of a particular device, e.g., a selected AP, and compare the measured location with a known location of the selected AP to verify that the sensors and server are performing the location operations correctly, and are operating within certain parameters.
  • a location process with certain sensors to determine the location of a particular device, e.g., a selected AP, and compare the measured location with a known location of the selected AP to verify that the sensors and server are performing the location operations correctly, and are operating within certain parameters. Protocol
  • the protocol manager 3230 in the server is responsible for logging the captured packets by the various sensors into a log file for later processing. There may be a time sync difference between sensors. Different sensors come up (power up) at different times and do not have a concrete time of day concept. They have a notion of ticks with respect to which the server software needs to normalize. For example, sensor 1 's tick 30 may represent the same instance of time as sensor 2's tick number 1000. The protocol manager software accounts for such skews.
  • the protocol manager 3230 may also provide aggregate packet statistic streams to a requesting client application.
  • the protocol manager 3230 synchronizes the packet arrival from different sensors into a common time line. That is, packets captured at the same time in two different sensors may reach the server at a certain time skew.
  • the protocol manager 3230 ensures that this time skew does not affect the packet traces.
  • the protocol manager 3230 also detects when multiple sensors may see the same packet and report it to the server and remove the duplicate packet.
  • a set of filters may be used to configure background and real-time filtering of packets (as well as configuring the size of the background log) and are executed by the protocol manager 3230. Finally, the protocol manager 3230 converts protocol packet information into the appropriate format for transport via the ISMI 3900.
  • the sensor manager 3180 periodically polls the sensors to see if they are well and alive. In the event a sensor unexpectedly goes down, then during this keep alive polling process, the server determines when a sensor is not responding (for whatever reasons) and notes that sensor as "non-functional.”
  • the polling interval or frequency is configurable and the Sensor Manager manages this configuration.
  • the sensor manager 3180 performs a sensor discovery function by detecting when a sensor is coming up or going down.
  • the server NSI provides the sensor manager 3180 with an indication about the sensor coming up or going down.
  • the sensor manager 3180 looks at the list of sensors that it has to manage and if that sensor is on the list, the sensor manager 3180 handles that event. In the event the sensor goes down, the sensor manager 3180 requests the server NSI 3250 to terminate the communication link with the sensor.
  • the sensor manager 3180 also sets up a connection with a sensor depending on whether the sensor coming up is in the server's domain or not. If the sensor coming up is in the server's domain (i.e., it has to be managed by the server) then the sensor manager 3180 requests the server NSI 3250 to set up a communication link with the sensor.
  • the sensor manager 3180 also has the responsibility of retrieving security keys for a sensor from the database and checking it against the key provided by the sensor. Only if they are identical should it allow the establishment of the communication link.
  • the sensor manager 3180 supports the configuration of topology information. This is the information about which sensors and device types the server manages.
  • the server manager 3170 is responsible for internal server management.
  • server manager 3170 determines that the various manager software are operating properly. Server resources like CPU, memory are monitored and whenever it exceeds a pre-configured threshold, remedial actions are initiated. For example, if available memory becomes low, a garbage collection utility may be run to free up memory. In addition, the server manager 3170 performs an aging process that ages out old records in the database to free up memory in the event available memory becomes low.
  • the SNMP agent 3310 is responsible for SNMP related functions, such as SNMP user authentication, processing a database get request to retrieve the data from the database 3110 and returning it to the requesting entity.
  • the SNMP agent 3310 performs trap support triggered by certain events. For example, in response to receiving an indication that a new sensor has come alive may cause the SNMP traps to be generated at the server. This will depend on the SNMP MLB definition. All tasks associated with MLB management are handled by the SNMP agent 3310.
  • the SQL connector 3340 is responsible for publishing the database schema and controlling user access to the database. Some users may have read only access and others may have read and write access.
  • the web interface 3330 is responsible for the configuration interface for the overall system to allow a user to view and modify system configurations. In addition, the web interface 3330 processes some pertinent statistics and the results of that analysis are presented to the user in a report format. Finally, the web interface 3330 validates all configuration entries entered by a user.
  • the web interface 3330 implements a server ISMI function and may support data in a variety of formats, including HTML or XML format.
  • the event manager 3150 receives events from sensors and dispatches the event information to other server software. Server managers register with the event manager 3150 to receive information on certain types of events.
  • the configuration manager 3160 pushes configurations to each sensor for initialization or configuration change. It also manages catastrophic event failure, scans policies of sensors and manages groups of 802.11 devices and sensors.
  • Event_types Event_types
  • the fields for the monitoring policy configurations data structure are the same as the fields for the Sensor Protocol Measurement Configuration, described below.
  • radio_cfgs_bands Tables referencing this one via Foreign Key Constraints: radio_cfgs_bands Table: Radio Frequency Band Configurations (radio_cfgs_bands)
  • the foregoing is an example of a database scheme that is useful to manage configuration information for server and sensor functions and data collected from the sensors.
  • the database 3110 populates the various database table structures with data collected from the sensors.
  • the performance and security manager may initiate various actions to mitigate the impact of current RF conditions. For example, in response to a high level of interference on a given channel, the performance manager could configure 802.11 APs in the vicinity of the interference to operate on other channels.
  • the performance and security manager make use of an action manager 3400.
  • the action manager 3400 comprises logic to interface to the various types of wireless equipment that may be operating in the network. For example, some APs could be configured via an SNMP interface, some might be configured via a HTML interface, and some might use a proprietary interface.
  • the action manager 3400 hides the details of these interfaces from the performance and security manager.
  • Other actions may include changing the packet fragmentation threshold, assigning a device to a different frequency sub-band or channel in the frequency band, network load balancing (on the basis of channel frequencies or time), adjusting the transmit power of the AP, adjusting the communication data rate, executing interference mitigation or co-existence algorithms, executing spectrum etiquette procedures, executing spectrum priority schemes, or re-assigning STAs to APs in a WLAN.
  • interference mitigation algorithms are disclosed in commonly assigned and co-pending U.S. Patent Publication No. 20020061031, published, May 23, 2002, and in U.S. Application No.
  • FIG. 6 illustrates the interaction of some of the server applications in more detail.
  • the server applications executes the functions described above in connection with FIGs. 4 and 5 and further include a message dispatcher 3500, a database manager 3112 and a Java database connectivity block (JDBC) 3114.
  • JDBC Java database connectivity block
  • Incoming spectrum and traffic/protocol data from the sensors is coupled to the message dispatcher 3500 that coordinates delivery of the data to the appropriate one of the other application services and to the database manager 3112 for registration and storage in the database.
  • the web interface 3330 coordinates exchange of information with a web server 3600.
  • the SNMP agent 3310 coordinates exchange of information with the various SNMP clients.
  • the web server 3600 executes a server ISMI function to exchange controls and data with the various ISMI clients referred to above.
  • the ISMI The ISMI
  • the ISMI is an API that interfaces control and information between the server and the outside world, e.g., client users at a network management station, as well as to generate controls generated by the action manager 3400 to make adjustments to WLAN equipment based on activity determined to be occurring in the frequency band.
  • the server implements a server ISMI (API) function (referred to above) to receive configurations from a client network management application and supplies data concerning activity in the wireless network and frequency band according to the configurations received from the client network management application.
  • API API
  • a client application implements a client ISMI (API) function to supply configurations concerning the type of information requested about activity in the wireless network and frequency band, and receives from the server ISMI function data concerning activity in the wireless network and frequency band according to the configurations.
  • client ISMI API
  • Examples of the configurations supplied by the client ISMI function to the server ISMI function, and of the data supplied by the server ISMI function to the client ISMI function are described in the tables below.
  • the ISMI may support several data transports, such as streaming socket- based, Web, XML, SNMP, SQL Connector. It provides access to and configuration of raw streams for protocol, spectrum and location data; and periodic measurement data for protocol, spectrum and location data. In addition, it provides an interface for processed event streams, such as discovery events, performance events and security events. Examples of the ISMI configurations and data are set forth in the following tables. Much of this information is redundant to the information stored in the database of the server.
  • the client is able to read and update the server configuration, which may include the following fields.
  • the client is able to read the server status, which may include the following fields:
  • the server 3000 can support multiple sites each of which may be monitored by a set of sensors.
  • a site has a defined zero location point.
  • An example of a site would be a building.
  • a number of zones may be defined.
  • a zone is marked by a physical perimeter, bounded by a set of location vertices which define a 3 -space polyhedron, for example.
  • the client can read and update the following site configuration and status information.
  • the client can read and update the following zone configuration and status information.
  • the client is able to request a list of existing sensors.
  • the client may also create a new sensor entry and enable it, in order to expedite set-up of new sensors.
  • the client can read and update the following sensor configurations.
  • the client can read and update the following sensor location measurement configuration.
  • the client can read and update the following sensor spectrum measurement and classification (SMC) configuration.
  • SMC sensor spectrum measurement and classification
  • the client can read and update the following sensor protocol measurement configuration.
  • the client can read and update the following discovery configuration parameters.
  • the client is able to request a list of current or historical devices. If desired, the list can be qualified by the following filters:
  • the client can read and update the following device parameters.
  • the performance manager 3130 is responsible for generating alerts when 802.11 network performance has been or may be adversely affected.
  • Performance Configuration The client can read and update the following performance configuration parameters.
  • the client can configure threshold levels for various statistics that will result in generation of threshold crossing alarms (TCA) events.
  • Simple thresholds may be set on individual statistics. For example, AQI ⁇ 25.
  • complex thresholds may be set on combinations of statistics using Boolean rules. For example: AQI ⁇ 25 AND Max Power > 20.
  • SAGE thresholds can be set using the following statistics for a channel:
  • 802.11 thresholds can be set using the following statistics for a channel, SSLD, or STA:
  • the security manager 3140 is responsible for generating alerts when 802.11 network security has been or may be adversely affected.
  • the client can read and update the following security configuration parameters.
  • the server 3000 generates an event stream which provides a high-level view of the operation of the system.
  • the client is able to set a filter view for events, find the start and end index of available events, and retrieve a set of events.
  • Event filters provide a mechamsm for the client to receive only events that are of interest, while ignoring other events. Event filters may also be used to examine historical data for recurrences of specific events.
  • the client can read and update the following event filter parameters:
  • the client can read and update the event configuration to change the type flags, severity, or store in database attributes of a particular event.
  • the server 3000 stores historical statistics data in a database.
  • the client can query these statistics for presentation to users, or for post-analysis.
  • the ISMI can set qualifiers for statistics, find the start and end time of available statistics data, and may retrieve a set of statistic data.
  • the client can specify the interval (start time, end time), and number of data points. For example, a client could query for the average AQI over the last week, with 50 data points.
  • Statistic qualifiers enable the client to focus on a specific area of interest, for example a particular channel or location.
  • the client can read and update the following statistic qualifier parameters:
  • the client can query data for the following statistics.
  • RF Statistics These statistics may be qualified by channel and sensor.
  • These statistics may be qualified by channel, sensor, SSID, location, and specific devices.
  • a client En addition to receiving periodic location data via the discovered device interface, it may be desirable for a client to request immediate location operations. These immediate operations may even take place on devices that have not yet even been discovered by the server.
  • An example is in the case of a client that is a location-based authentication system. En this case, a new 802.11 device has been powered on and wants to access the network. Because the device has just become active, it may not yet have been discovered by the server. n this case, the authentication server is able to request an immediate location operation.
  • the following data is supplied by the client in order to "force discovery" of a device, and to perform an immediate location operation on the 802.11 device:
  • the "Associating with AP" field is used to determine the relative location of the device. This is important so that the proper sensors are used for the location operation. After the immediate location operation has taken place, the 802.11 device becomes part of the discovered set of devices. Its location (and other parameters) may be queried through the interface described above.
  • the client may access a stream of raw SAGE spectrum data from any sensor.
  • the measurement engine in the corresponding sensor generates this data.
  • the following fields are contained in a request from a client to configure a new raw spectrum stream for a particular sensor, and are also used to turn off an existing stream.
  • SAPF Spectrum Analyzer Power vs. Frequency
  • the following fields are contained in the streaming data from the server. This data provide a statistical analysis of the data in the frequency spectrum. A single message is built from a specific number of Fast Fourier Transform (FFT) cycles. Statistics may be taken over a time period of 1/10 of a second for a single message. Typically, there are 256 frequency bins.
  • FFT Fast Fourier Transform
  • a pulse is a sustained emission of RF energy in a specific bandwidth starting at a specific time.
  • the basic characteristics of an RF pulse are:
  • Start Time Measured from when the sensor first begins detecting pulses.
  • Duration The lifetime of the pulse.
  • the center frequency of the pulse The center frequency of the pulse.
  • PEVT pulse event
  • Each instance of the PulseEvents field describes the properties of one pulse.
  • the statistics provided by the NSI include:
  • the distribution of the duration of the pulses (the percentage of pulses with short, medium, and long durations).
  • the distribution of the gaps in time between the pulses (the percentage of pulses with short time gaps between them, medium time gaps, and long time gaps).
  • Pulse Duration Histogram Each of the data bytes, or bins — in sequence — indicates the percentage (multiplied by two) of pulses that fall into a given range of durations.
  • Pulse Gap Histogram Format instead of measuring the width of pulses, each bin in sequence indicates the percentage (multiplied by two) of gaps between pulses, where the duration of the gap falls within a given time range. Gaps are measured between the start of one pulse and the start of the next. This is because the start of a pulse tends to be sharply delineated, while a pulse may trail off more gradually.
  • Pulse Bandwidth Histogram Each data byte, or bin, reflects a progressively wider bandwidth.
  • the value stored in the bin is the percentage, multiplied times two, of the pulses that had a bandwidth somewhere within the indicated range.
  • the N th bin represents pulses with bandwidths between [(N - 1) * binSizeKHz], and [N * binSizeKHz].
  • the value of the byte represents the % * 2 of pulses whose bandwidths fell within this range.
  • SMC_PH1ST_N_FREQ_BENS ⁇ 256 ⁇ bins.
  • Each data byte, or bin reflects a range of frequencies.
  • the value stored in the bin is the percentage, multiplied times two, of the pulses whose center frequency fell within the indicated range of frequencies.
  • the range of frequencies that are represented by each bin is determined by the user when this services is configured.
  • Each bin reflects a certain power range, measured in dBm.
  • the value of each bin reflects the percentage, multiplied times 2, of those pulses whose power level fell within the indicated range.
  • the range of each bin is SMC_PHIST_POWER_BIN_SIZE ⁇ 5 ⁇ dBm, and the lowest power of the lowest bin is SMC_PHIST_MIN_POWER_DBM ⁇ -130 ⁇ dBm.
  • SMC_PHIST N_POWER_BENS ⁇ 30 ⁇ bins.
  • the client is able to access a stream of filtered 802.11 packets from any sensor.
  • Protocol Stream Configuration The following fields are used in a request from a client to configure a raw protocol stream for a particular sensor, and are used to close an existing stream.
  • Protocol Stream Filtered Frame Data This data is used to send captured 802.11 frames that match the configured filter.
  • FIG. 7 is a ladder diagram that illustrates how the sensor and server coordinate for an exemplary process.
  • the process 5000 of FIG. 7 is one involving detection and location of an unauthorized or "rogue" AP.
  • the protocol engine sends periodic messages that include a list of APs and STAs that are detected from packets that the sensor receives.
  • the messages from the protocol engine are forwarded in step 5020 to the discovery manager in the server.
  • the discovery manager reads the list of information contained in the message from the sensor and generates an AP Up Event that is forwarded to the database to create/update a record.
  • an AP Up Event is forwarded, via the event manager, to the security manager in step 5040.
  • step 5050 the security manager polls the database to capture information about the AP associated with the AP Up Event, and compares an address or other identifier of the AP against a list of authorized APs to determine whether or not the AP is authorized.
  • step 5060 the security manager updates the records in the database to indicate whether or not the AP is authorized. In this example, it is assumed that the AP is not authorized, and such an indication is made in the database.
  • step 5070 the security manager generates an AP unauthorized event that is forwarded, via the event manager, to the discovery manager. In response to receiving a notification of the AP unauthorized event, in step
  • the discovery manager sends a request to the location manager to locate the unauthorized AP.
  • the location manager sends a location request message to the sensors (likely including the sensor that detected the unauthorized AP) to perform a location operation in order to determine the physical location of the AP.
  • the location request message is forwarded by the NSI to the location engine in the respective sensors. The sensors perform the location operation and in so doing generate raw location data that is forwarded to the NSI in step 5110.
  • the NSI forwards the raw location data (from each sensor) to the location manager.
  • the location manager computes the location of the AP using the raw location data from each sensor and in step 5130 forwards the location information to the discovery manager.
  • the discovery manager then forwards this information to the database manager to be added to the record for the unauthorized AP.
  • information may be passed out via the
  • FIG. 8 shows a process 5200 in which an interfering signal (a signal interfering to an 802.11 WLAN) is detected and the source of the signal is located.
  • an interfering signal a signal interfering to an 802.11 WLAN
  • step 5210 the classification engine sends an interfering (type) Up Event to the NSI.
  • the NSI forwards the message in step 5220 to the discovery manager.
  • step 5230 the discovery manager sends a create record message to the database manager to create a record in the database for the detected interferer.
  • the spectrum data e.g., bandwidth, signal strength, center frequency(ies), duration, etc.
  • the discovery manager sends an interferer (type) Up Event message to the event manager.
  • the discovery manager sends a request to the location manager to locate the source of the interferer.
  • the location manager then sends a location operation request message to the sensors that are used for the location operation.
  • the NSI forwards the location operation request message to the location engine in each sensor used for the location operation. After the sensor generates the raw location data, in step 5280, it forwards it to the NSI which in step 5290 forwards it to the location manager.
  • the location manager computes the location of the interferer and forwards that information in step 5300 to the discovery manager.
  • the discovery manager sends a message to the database manager to add the location data to the record for the interferer.
  • the ISMI may be configured to deliver the spectrum data that was stored in the database record for the interferer either on demand in response to a request from a client application, or automatically upon discovery of the interferer.
  • the spectrum data about the interferer may provide useful information to a network administrator in order to consider evasive or other mitigation actions.
  • the client application may request from the sensor that detected the interferer, via the server, real-time spectrum data that includes more current and additional information about the interferer than what was stored in the database when the interferer was reported to the server.
  • location information obtained for a particular device or class of devices is that information or content can be delivered to certain devices based on their physical location.
  • information describing a particular piece of art may be delivered based on a user's proximity to that piece.
  • a similar location model can be used in merchandising applications, where information about a particular product or serviced is delivered to that user when the user's STA is in sufficient proximity to it.
  • location may be used to enforce policies that allow access to a wireless network when the device is in a certain region (e.g., visitor or reception area of an enterprise), but not in other areas (e.g., inside the company's facilities).
  • a visitor having a laptop with WLAN connectivity may have access to a wireless network (to get Internet connectivity), but no (or limited) WLAN connectivity once inside the company's offices.
  • the visitor's STA likely has an address or identifier that is not authorized to the company's WLAN management system, but the discovery manager and or server manager would be configured to permit the visitor's access to the WLAN only in the company's reception area, and only for Internet service.
  • Locating an IEEE 802.11 Device Interaction Between Server and Sensors
  • the Loc Req and Loc Resp messages referred to above are defined in more detail below. This description assumes that the server has already identified the sensors to be involved in the operation, including which sensor acts as the MRT sensor. In general, the sensor that acts as the MRT is the sensor that receives the signal of the device to be located with the strongest RSSI. 1.
  • the location manager 3220 in the server 3000 sends a set-up message to each of the sensors 2000(i) that are to be used in the location process.
  • the set-up message includes the address of the MRT, the frequency channel on which the signals used in the experiment will be on, and the address of the IEEE 802.11 device to be located (often called the target terminal (TT)).
  • Each of the sensors that receive the set-up message configures themselves to prepare for the location operation.
  • the location engine 2730 requests access to the SAGE snapshot buffer resource via the measurement engine 2710.
  • the snapshot buffer will be in a free-running state continuously storing captured signal data in a circular buffer fashion.
  • the sensor After each sensor configures itself in preparation for the location operation, the sensor sends a "ready" message back to the server advising it that it is ready for the operation. Alternatively, the sensors may send this message to the MRT sensor and the MRT sensor sends no such message.
  • the server sends a message to the MRT sensor advising it that it is safe to initiate the location operation. If the ready messages are sent directly to the MRT sensor, then this step is not necessary.
  • the MRT sensor sends a series of 802.11 frames.
  • the MRT sensor sends a request-to-send (RTS) frame (first signal) addressed to the TT device.
  • the TT device responds with a clear-to-send (CTS) frame (first response signal).
  • CTS clear-to-send
  • the MRT sensor sends a unicast Probe Request frame (second signal) to the TT device.
  • the TT device responds to the Probe Request frame with an ACK frame (second response signal).
  • This sequence of frames actually yields two pairs of TDOA measurements (between the RTS and CTS and between the Probe Request and ACK).
  • the MRT sensor and the RT sensors in the experiment receive these frames and store in their snapshot buffers the receive signal data (with reference to their own clocks) associated with the signals they received.
  • the RT sensors are running their snapshot buffers in a continuous store mode and then in response to detecting the Probe Request frame, put their snapshot buffers into a post-store mode that extends long enough to capture the ACK frame.
  • the snapshot buffer in the MRT sensor is continuously storing and stops storing in response to detecting an ACK frame, or timing out if no ACK frame is received.
  • Each of the sensors examines the content of their snapshot buffers, and using the Probe Request frame as a unique reference point, look forward and backward (in time in the snapshot buffer) to identify the RTS/CTS exchange and to identify the ACK frame subsequent to the Probe Request. With the relevant data identified, the location engine 2730 in the sensors then uses suitable correlators to precisely determine the time of arrival of each of the frames, and from that information, determine the time difference of arrival (between the RTS and CTS for one TDOA data point, and between the Probe Request and ACK for another TDOA data point). 6. The sensors send the TDOA data back to the location manager 3220 of the server. The location manager 3220 in the server then performs the computations on the TDOA data to derive the location ofthe TT.
  • Locating a non-802.1 1 device i.e., an interferer, such as a Bluetooth signal, microwave oven or cordless phone.
  • This process is different because the TT device does not respond to IEEE 802.11 frames. This process can be used for known interferers as well as interferers that are not known (such as may be the case for a device causing an RF level denial of service attack).
  • the location manager 3220 sends a set-up message to each of the sensors that are to be used in the location process, similar to the set- up message described above, except that it does not include the address of the TT device. Rather, it includes a message informing the MRT sensor to configure the pulse detector(s) in its SAGE block to generate a trigger signal upon detecting the TT signal. From previous transmission of the TT signal, the MRT sensor would already have classified the TT signal and is capable of configuring a pulse detector (in its SAGE block) to continue to detect it and generate a trigger signal in response thereto.
  • the sensors configure themselves, and send a ready signal to the server or MRT sensor.
  • the MRT sensor is ready to initiate the location operation.
  • the MRT sensor transmits a Probe Request frame in response to detecting the TT signal. In doing so, the MRT sensor computes the time delay between receiving the TT signal and sending the Probe Request frame.
  • the RT sensors continuously capture receive signal data and use the Probe Request frame data in the snapshot buffer as a marker for where to look back in the buffer for the TT signal.
  • the RT sensors terminate further capturing of data a short period of time later upon detecting the Probe Request frame.
  • the MRT sensor sends the time delay information it computed to the RT sensors so that the RT sensors can use it to locate the TT signal in their buffers with respect to the Probe Request frame.
  • the location engine 2730 in the MRT sensor and RT sensors then determine the time of arrival of the TT signal and the time of arrival of the Probe Request frame, and from that information compute the
  • the sensors send the TDOA data to the location manager 3220 in the server 3000, where the location is computed based on the TDOA data.
  • the interfering signal is a signal that none of the sensors have a correlator for (in order to accurately determine the time of arrival of the device's signal transmissions)
  • one technique is to use as a reference waveform (a correlator) the receive signal sample data obtained at the RT sensor that best receives the interferer's signals.
  • a correlator the receive signal sample data obtained at the RT sensor that best receives the interferer's signals.
  • FIG. 9 illustrates how a plurality of sensors 2000(1) to 2000(4) are deployed within an office environment and coupled to a server 3000.
  • a network management station 4000 executing one or more network management client applications, is coupled to the server.
  • the sensors 2000(1) to 2000(4) will detect the activity occurring in the frequency band and the network management station 4000 may generate a location map display that indicates locations of APs, STAs, no WLAN coverage areas, possible rogue devices, where interference devices, etc.
  • a single or multiple servers may couple to sensors deployed throughout the building, and servers associated with each building on a multi-building campus site may be coupled to a super server, as described above in conjunction with FIG. 1.
  • a super server may manage, via a WAN connection perhaps using the Internet, multiple servers associated with building sites at multiple geographic locations.
  • FIGs. 10-17 are diagrams depicting an example of a client application that consists of a graphical user interface (GUI) application to display data generated by the server and configure functions of the server.
  • GUI graphical user interface
  • the GUI application is referred to hereinafter as a console application and it has a launcher bar 6000 with indicators 6100 and buttons 6200 through 6240.
  • the console application communicates with the server through the ISMI.
  • the ISMI may be implemented in XML and SNMP.
  • a user may access information on a WLAN and the surrounding RF environment by selecting any of the console's viewers: the event log viewer shown in FIGs. 11 and 12 is accessed via button 6200, the location map shown in FIGs. 13 and 14 is accessed via button 6210, the spectrum viewer shown in FIG. 15 is accessed via button 6220 and the protocol viewer shown in FIG. 16 is accessed via button 6230.
  • the configuration button 6240 provides access to a configuration screen shown in FIG. 17.
  • the four status indicators 6100 (system, interference, performance and security) on the launcher bar are similar to the LEDs found on many electronic devices. Each indicator may have three colors: Green, Yellow, and Red. Any change in color indicates that a certain severity event has taken place.
  • the event log viewer maintains a running list of all WLAN and RF events, such as RF devices which have been turned on or off.
  • FIG. 11 shows the list
  • FIG. 12 shows the details of particular event selected from the list shown in FIG. 11.
  • Each record in the event log display has the following fields: severity, flag, date and time, ED, and summary.
  • the severity levels for an event are severe, major, minor, info, and debug and are explained as follows. Severe. The event may result in, or has resulted in, major failure of the
  • WLAN integrity This may include an AP failure, or a security attack which is preventing network operations or compromising network security (such as a rogue AP, 802.11 device operating outside the security perimeter, and denial of service attack).
  • AP failure or a security attack which is preventing network operations or compromising network security (such as a rogue AP, 802.11 device operating outside the security perimeter, and denial of service attack).
  • the WLAN is still running, but the event is causing or may cause a significant impact on network performance or security. This may include clients that have disappeared from the network without logging out, APs or clients running at very low data rates, major excess load on one or more channels, significant increases in RF interference and detection of potential security threats. Minor.
  • the event represents an unusual behavior which may signal potential problems. Includes significant retransmissions of frames, moderate excess load on one or more channels, suspicious device movement and moderate increases in RF interference.
  • Debug These are specialized events that a user will not normally want to see, but that may need to see in order to identify a problem with the system itself.
  • One or more flags indicate the general type of event: Discovery.
  • a new device has been identified (may be an 802.11 device or an interferer).
  • Security The event has some impact on network security (for example, a rogue AP has been detected, or a device is transmitting without using WEP encryption).
  • the event reflects an issue with the system itself, such as sensor or server problems.
  • the event concerns an 802.11 device, such as a new device joining the network, or an AP that is no longer functioning.
  • the location map shows the location of all RF sources and facilitates configuring a security perimeter.
  • the cursor By moving the cursor over an device icon on the map, the name, EP address and MAC address is displayed.
  • FIG. 14 shows how a user may draw a security perimeter overlaid on the map.
  • FIG. 15 shows the how spectrum viewer displays raw RF spectrum and pulse data as detected by a specific sensor. A user can select which sensor's data is displayed.
  • the protocol viewer displays both detailed and summary information on 802.11 frames which are detected by sensors in the system. Additional examples of the spectrum viewer displays are disclosed in commonly assigned and co- pending U.S. Application No. 10/420,515.
  • FIG. 16 illustrates how the protocol viewer displays protocol statistics.
  • FIG. 17 illustrates a configuration dialog that enables a user to configure which types of events to be reported by the event log (e.g., 802.11 events, location events, performance events, security events, etc.); and the minimum severity of the events that will be shown (all events, minor problems, major problems, etc.).
  • the configuration dialog and also allows a user to configure the kinds of plots displayed by the spectrum viewer. A user can choose which types of events to be shown on the event log. A single event will often have multiple flags. Moreover, a user can control both the types of events that should be displayed, and the level of severity associated with that event.
  • a system that monitors activity in a shared frequency band and on a wireless network that operates in the shared frequency band.
  • the system comprises a server and a plurality of radio sensors that are coupled to the server and are positioned at various locations in a region where activity in a shared radio frequency band is occurring.
  • Each of the plurality of radio sensors comprises a first radio receiver capable of receiving radio signals in a radio frequency band; a spectrum analysis system coupled to the radio receiver that produces spectrum activity information representative of the activity in the frequency band; a baseband signal processing section coupled to the first radio receiver that demodulates signals transmitted by other devices on a wireless network in the frequency band according to the communication protocol; a second radio receiver coupled to the baseband signal processing section that receives signals on the wireless network and couples received signals to the baseband signal processing section.
  • the baseband signal processing section may be further capable of modulating signals in accordance with the communication protocol for transmission on the wireless network in the frequency band.
  • the sensor further comprises a transmitter that transmits signals modulated by the baseband signal processing section.
  • a processor is coupled to the spectrum analysis system and to the baseband signal processing section, wherein the processor executes one or more programs to analyze packets transmitted by devices on the wireless network in the frequency band based on signals demodulated by the baseband signal processing section and to classify radio signals occurring in the frequency band based on the spectrum activity information output by the spectrum analysis system.
  • the server receives data from each of the plurality of radio sensors and executes functions to process the data supplied by the plurality of sensors.
  • the server executes a the server executes a performance function that monitors and generates events related to the performance of the wireless network, a discovery function that monitors and generates events pertaining to devices operating in the wireless network or other radio frequency emitters in the frequency band and a security function that monitors and generates events related to security threats to the wireless network.
  • the server interfaces data generated by its various functions to a client application, e.g., a network management application.
  • the server is configurable by a network management application through an application programming interface (API) with respect to the type of information requested about activity in the wireless network and/or frequency band, and the server supplies aggregated data from the plurality of radio sensors to the network management application through the API.
  • API application programming interface
  • a method for analyzing data pertaining to activity in a shared radio frequency band comprising steps of receiving data from each of a plurality of radio sensor devices deployed in different locations to detect activity in the radio frequency band, wherein the data includes identifiers types of signals determined to be occurring in the frequency band and statistics concerning traffic on wireless network operating in the radio frequency band; aggregating the data; and analyzing the data.
  • the step of analyzing may comprise executing a performance function that monitors performance of the wireless network based on aggregated traffic statistics, executing a discovery function that monitors and generates events pertaining to devices operating in the wireless network or other radio frequency emitters in the frequency band, and executing a security function that monitors and generates events related to security threats to the wireless network.
  • a method for interfacing a network management application with a plurality of radio sensor devices that monitor activity in a frequency band in which a wireless network and other interfering signal activity may be occurring comprising steps of receiving configurations from the network management application concerning the type of information requested about activity in the wireless network and/or frequency band; and supplying data concerning activity in the wireless network and/or frequency band according to configurations.
  • This corresponds to the ISMI API function executed by the server.
  • a method for interfacing a network management application with a plurality of radio sensor devices that monitor activity in a frequency band in which a wireless network and other interfering signal activity may be occurring comprising generating configurations at the network management application concerning the type of information requested about activity in the wireless network and/or frequency band; and receiving data concerning activity in the wireless network and/or frequency band according to configurations.
  • this ISMI API function may be embodied by instructions encoded on a processor readable medium, that, when executed by processor (the processor running the client application), the processor performs the steps described above.
  • this ISMI API function may be embodied as part of a system comprising the application program (the client application) and the application programming interface that executes the steps described above. The above description is intended by way of example only.

Abstract

An intelligent spectrum management (ISM) system and method are provided that includes sophisticated features to detect, classify, and locate sources of RF activity. The system comprises one or more sensor[2000] positioned at various locations in a region where activity in a shared radio frequency band is occurring and a server [3000] coupled to the sensors [2000]. Each sensor [2000] monitors communication traffic, such as IEEE WLAN traffic, as well as classifies non-WLAN signals occurring in the frequency band. The server [3000] receives data from each of the plurality of sensors [2000] and that executes functions to process the data supplied by the plurality of sensors [2000]. In particular, the server [3000] aggregates the data generated by the sensors [2000] and generates event reports and other configurable information derived from the sensors [2000] that is interfaced to a client application [4005], e.g., network management station.

Description

I
SERVER AND MULTIPLE SENSOR SYSTEM FOR MONITORING ACTIVITY IN A SHARED RADIO FREQUENCY BAND
This application claims priority to the following U.S. Provisional Patent Applications:
U.S. Application No. 60/508,635, filed October 3, 2003, entitled "Sensor Network System for Monitoring and Managing Activity in a Shared Frequency Band."
U.S. Application No. 60/502,947, filed September 16, 2003, entitled "Interface and Method for Interfacing Spectrum and Event Information Concerning Activity in a Frequency Band."
U.S. Application No. 60/511,383, filed October 15, 2003, entitled "Spectrum Management Interface Between Management Client Applications and a Spectrum Aggregation and Analysis Server." U.S. Application No. 60/508,636, filed October 3, 2003, entitled "System and Method for Interfacing Spectrum and Location Information Pertaining to Activity in a Shared Frequency Band."
The entirety of each of these applications is incorporated herein by reference.
RELATED APPLICATIONS
The assignee of the present application has filed several applications related to the subject matter of the present application, the entirety of each of which is incorporated herein by reference. 1. Spectrum Management Patent Applications
Systems for managing activity in an unlicensed frequency band are described in the following applications:
U.S. Application No. 10/246,363, filed September 18, 2002, entitled "System and Method for Spectrum Management of a Shared Frequency Band." U.S. Application No. 10/420,515, filed April 22, 2003, entitled "System and
Method for Management of a Shared Frequency Band." U.S. Application No. 10/641,973, filed August 15, 2003, entitled "System and Method for Management of a Shared Frequency Band Using Client-Specific Management Techniques."
2. Signal Classification Patent Applications Techniques for classifying (identifying) signals occurring in a frequency band based on radio frequency (RF) information are disclosed in the following applications:
U.S. Application No. 10/246,364, filed September 18, 2002, and entitled "System and Method for Signal Classification of Signals in a Frequency Band." U.S. Application No. 10/420,362, filed April 22, 2003, and entitled "System and Method for Classifying Signals Occurring in a Frequency Band."
U.S. Application No. 10/628,603, filed July 28, 2003, and entitled "System and Method for Classifying Signals Using Timing Templates, Power Templates and Other Techniques." 3. Real-Time Spectrum Analysis Patent Applications
A real-time spectrum analysis engine (SAGE) useful for generating the raw spectrum information that is used for signal classification and related functions is disclosed in the following applications:
U.S. Application No. 10/246,365, filed September 18, 2002, and entitled "System and Method for Real-Time Spectrum Analysis in a Communication Device."
U.S. Application No. 10/420,511, filed April 22, 2003, and entitled "System and Method for Real-Time Spectrum Analysis in a Radio Device."
4. Wireless Device Location Measurement Patent Application Techniques for determining the location of wireless devices are disclosed in the following applications:
U.S. Application No. 10/409,563, filed April 8, 2003, entitled "System and Method for Locating Wireless Devices in an Unsynchronized Wireless Environment." U.S. Application No. 60/469,647, filed May 12, 2003, and entitled "System and Method for Locating Sources of Unknown Wireless Radio Signals." BACKGROUND OF THE INVENTION
The present invention relates to a system and method for managing a shared frequency band using a plurality of sensors positioned to capture information concerning activity in the shared frequency band. The explosive growth in wireless applications and devices over the past few years has produced tremendous public interest benefits. Wireless networks and devices have been deployed in millions of offices, homes, and more recently, in increasing numbers of public areas. These wireless deployments are forecast to continue at an exciting pace and offer the promise of increased convenience and productivity.
This growth, which is taking place mostly in the unlicensed bands, is not without its downsides. In the United States, the unlicensed bands established by the FCC consist of large portions of spectrum at 2.4 GHz and at 5 GHz, which are free to use. The FCC currently sets requirements for the unlicensed bands such as limits on transmit power spectral density and limits on antenna gain. It is well recognized that as unlicensed band devices become more popular and their density in a given area increases, a "tragedy of the commons" effect will often become apparent and overall wireless utility (and user satisfaction) will collapse. This phenomenon has already been observed in environments that have a high density of wireless devices.
The types of signaling protocols used by devices in the unlicensed bands are not designed to cooperate with signals of other types also operating in the bands. For example, a frequency hopping signal (e.g., a signal emitted from a device that uses the Bluetooth™ communication protocol or a signal emitted from certain cordless phones) may hop into the frequency channel of an IEEE 802.11 wireless local area network (WLAN), causing interference with operation of the WLAN. Thus, technology is needed to exploit all of the benefits of the unlicensed band without degrading the level of service that users expect.
Historically, the wireless industry's general approach to solving "tragedy of the commons" problems has been for manufacturers to simply move to another commons further up the spectrum. This solution, however, is not workable for much longer, due to spectrum scarcity and to the less attractive technical characteristics of the higher bands (decreased signal propagation and the inability to penetrate surfaces).
Enterprise uses of the unlicensed band are focused on larger scale deployment of wireless networks (e.g., WLANs) and integration into wired networks. WLANs can complicate existing network management schemes because they introduce the additional requirement of efficiently managing radio spectrum. Current WLAN systems and management technology are focused on managing activity at the network level of the WLAN, but provide little or no capability to manage the frequency band where signals of multiple types (e.g., communication protocol/network types, device types, etc.) are present.
There are many shortcomings of existing WLAN system technologies. Current WLAN technologies are only generally aware of other network elements. They have no way to discover other nearby sources emitting RF signals in the unlicensed bands. The lack of device discovery and location functions exposes existing WLANs to significant security vulnerabilities. While current WLANs can perform standard authentication services and encryption services, they are vulnerable to imposter stations, denial-of-service attacks, parking lot attacks, and other security breaches.
SUMMARY OF THE INVENTION
Briefly, an intelligent spectrum management (ISM) system and method are provided that includes sophisticated features to detect, classify, and locate sources of RF activity. The system comprises one or more radio sensor devices positioned at various locations in a region where activity in a shared radio frequency band is occurring. A server is coupled to the radio sensor devices and aggregates the data generated by the sensor devices. Each radio sensor device comprises a spectrum monitoring section and a traffic monitoring section. The spectrum monitoring section comprises a radio receiver capable of receiving radio signals in a radio frequency band, a spectrum analysis system coupled to the radio receiver for generating spectrum (radio frequency) activity information representative of the (radio frequency) activity in the frequency band. The traffic monitoring section comprises a baseband signal processing section that demodulates signals transmitted by other devices on a wireless network in the frequency band according to the communication protocol and a radio receiver coupled to the baseband signal processing section that receives signals on the wireless network and couples received signals to the baseband signal processing section. A processor is coupled to the spectrum monitoring section and to the traffic monitoring section. The processor executes one or more programs to analyze packets transmitted by devices on the wireless network in the frequency band based on signals demodulated by the baseband signal processing section and to classify radio signals occurring in the frequency band based on the spectrum activity information output by the spectrum analysis system.
The server receives data from each of the plurality of sensor devices and executes functions to process the data. For example, the server executes a performance function that monitors and generates events related to the performance of the wireless network, a discovery function that monitors and generates events pertaining to devices operating in the wireless network or other radio frequency emitters in the frequency band and a security function that monitors and generates events related to security threats to the wireless network. In addition, the server interfaces data generated by its various functions to a client application, e.g., a network management application. The server is configurable by a network management application through an application programming interface (API) with respect to the type of information requested about activity in the wireless network and/or frequency band, and the server supplies aggregated data from the plurality of radio sensors to the network management application through the API. The above and other advantages of this technique will become more apparent when reference is made to the following description taken in conjunction with the accompanying drawings.
BRIEF DESCRIPTION OF THE DRAWINGS
FIG. 1 is a block diagram of a spectrum management sensor system. FIG. 2 is a block diagram of a sensor.
FIGs. 3 and 4 are functional block diagrams of the server and a sensor. FIG. 5 is a software block diagram of a sensor. FIG. 6 is a software block diagram of the server.
FIGs. 7 and 8 are ladder diagrams of two exemplary processes that may be executed by the system.
FIG. 9 is a diagram showing how pluralities of sensors are deployed in an office environment in which WLAN and other activity is occurring.
FIG. 10 is a diagram showing a launcher bar of a console graphical user interface client application.
FIGs. 11-17 show various console application display screens that display data generated by the server.
DETAILED DESCRIPTION OF THE DRAWINGS
The system, methods, software and other technologies described herein are designed to cooperatively manage use of a shared frequency band where signals of multiple types occur (often simultaneously), such as an unlicensed band, and interference among the users of the band may occur. Many of the concepts described herein may apply to frequency bands that are not necessarily "unlicensed," such as when a licensed frequency band is used for secondary licensed or unlicensed purposes.
The term "network" is used hereinafter in many ways. There may be one or more wireless networks each comprising multiple devices or nodes that operate in the shared frequency band. One example of such a network is a WLAN. There are also networks, called piconets, which are formed with Bluetooth™ capable devices. Many of the examples described herein are made with respect to an IEEE 802.11 (also known as WiFi™) WLAN, mostly due in part to the expansive use that the WLAN has seen, and is expected to continue to see. In addition, the term network is referred to a wired network, and to an aggregation of one or more wired and wireless networks. The spectrum management systems, methods, software and device features described herein new are not limited to any particular wireless network, and are equally applicable to any wireless network technologies now known or hereinafter developed for use in a shared frequency band. The Environment
Referring first to FIG. 1 , an environment is shown where there are multiple devices that at some point in their modes of operation transmit or emit signals within a common frequency band, and that may at least partially overlap in frequency and time. When these devices are sufficiently close in proximity to each other, or transmit signals at sufficiently high power levels, there will inevitably be interference between signals of one or more devices. The dotted- line shown in FIG. 1 is meant to indicate a region where activity from any of the devices shown may impact other devices. A region may be a building in which there are multiple zones of unlicensed band activity. The concept of zones is described further hereinafter. FIG. 1 shows a non-exhaustive exemplary selection of devices that may operate in an unlicensed frequency band, including cordless phones 1000, frequency hopping communication devices 1010, microwave ovens 1020, a wireless local area network (WLAN) comprised of a WLAN access point 1050(1) and its associated client station (STAs) 1030(1), 1030(2) to 1030(N), infant monitor devices 1060 as well as any other existing or new wireless devices 1070. Multiple WLAN APs 1050(1) to 1050(N) may be operating in the region, each of which has one or more associated client STAs 1030(1) to 1030(N).
One or more of the WLAN APs 1050(1) to 1050(N) may be connected to a wired network (e.g., Ethernet network) to which also connected is a server 1055. Cordless phones 1000 may be analog, digital and frequency hopping devices, depending on the type. Frequency hopping communication devices 1010 may include devices operating in accordance with the Bluetooth™ wireless communication protocol, the HomeRF™ wireless communication protocol, as well as cordless phones. In addition, radar devices 1080 may operate in an unlicensed frequency band. Other devices that may operate in the frequency band may also include appliances such as digital (still and/or) video cameras, cable-set top boxes, etc.
The spectrum management system described herein involves deployment of a plurality of sensors 2000(1) to 2000(N) shown in FIG. 1 in various locations or zones where activity associated with any of the plurality of signal types is occurring in the frequency band to form a sensor overlay network. The spectrum and protocol intelligence gathered by the spectrum sensors is fed to a server 3000. There may be multiple servers 3000(1) to 3000(P) each coupled to a plurality of sensors. A super server 7000 may connect to the plurality of servers 3000(1) to 3000(P) to manage each of the servers. There may be one server for each building or portion of a building, and the super server 7000 may manage the servers across a campus of buildings. For simplicity, a single server 3000 (corresponding to server 3000(1)) will be referred to in the following description. The server 3000 contains the aggregation and analysis software which processes low-level spectrum and protocol data from the sensors 2000(1) to 2000(N) and provides network level services described hereinafter. The sensors 2000(1) to 2000(N) are referred to as "agents" to the server 3000. A network management station 4000 executes one or more end-user client management applications 4005 or contains network management server software that requests services from the server. The network management station 4000 may include one or more processors 4100, memory 4200 and a display 4300. An example of an end-user management application is one that provides a console graphical user interface (GUI) to network engineers or IT managers. Some of the functions which may be performed by a network management server include WLAN management functions, such as (1) AP configuration, AP firmware upgrades, etc.; (2) security management such as authentication or virtual private network (VPN) management; and (3) management of other networks, such as a wired Ethernet network. The network management station 4000 is referred to as a "client" to the server 3000. The network management station 4000 may e part of a larger WLAN management infrastructure including servers and switches, which in turn, interfaces with a generalized (wired and wireless) network management infrastructure.
The Sensor
Turning now to FIG. 2, each sensor 2000(i) comprises a spectrum monitoring 2100 section to monitor RF activity in the frequency band and a traffic monitoring section 2500 that is capable of sending and receiving traffic according to a communication protocol, such as an IEEE 802.11 WLAN protocol. The spectrum monitoring section 2100 comprises a radio 2110 (primarily for receive operations) that is capable of tuning to receive energy at each channel (or simultaneously all channels in a wideband mode) of, for example, any of the unlicensed bands (2.4 GHz and 5 GHz) in which IEEE 802.11 WLANs operate. An analog-to-digital converter (ADC) 2112 is coupled to the radio 2100 that converts the downconverted signals from the radio 2100 to digital signals. A radio interface (I/F) 2120 is coupled directly to the radio 2100 and also to the output of the ADC 2112. A spectrum analysis engine (SAGE) 2130 is coupled to the radio I/F 2120. The SAGE 2130 is thoroughly described in the aforementioned co- pending and commonly assigned patent applications, and includes a spectrum analyzer 2132, a signal detector 2134 consisting of a peak detector 2136 and one or more pulse detectors 2138, and a snapshot buffer 2140. A Fast Fourier Transform (FFT) block (not shown) is coupled between the I/F 2120 and the spectrum analyzer 2132, or included in the spectrum analyzer 2132. The SAGE 2130 generates spectrum activity information that is used in the sensor and the server to determine the types of signals occurring in the frequency band, and captures signals for location measurement operations. A dual port random access memory (RAM) 2150 is coupled to receive the output of the SAGE 2130 and a processor I/F 2160 interfaces data output by the SAGE 2130 to a processor 2700, and couples configuration information from the processor 2700 to the SAGE 2130. The functions of the SAGE 2130 will be briefly described in further detail hereinafter. The spectrum analyzer 2132 generates data representing a real-time spectrogram of a bandwidth of radio frequency (RF) spectrum, such as, for example, up to 100 MHz. The spectrum analyzer 2132 may be used to monitor all activity in a frequency band, for example, the 2.4-2.483 GHz ISM band, or the 5.15-5.35 GHz and 5.725-5.825 GHz UNII bands. The FFT block referred to above is, for example, a 256 frequency bin FFT block that provides (I and Q) FFT data for each of 256 frequency bins that span the bandwidth of frequency band of interest. A spectrum correction block may be included to correct for I and Q channel imbalance by estimating an I-Q channel imbalance parameter related to phase error and amplitude offset between the I and Q channels, and to suppress a side tone resulting from the RF downconversion process. The spectrum analyzer 2132 may further comprise a power computation block that computes (FFTdataI)2 and (FFTdataQ)2, respectively, and adds them together, to output a power value for each FFT frequency bin. The spectrum analyzer 2132 may further include a stats logic block that has logic to accumulate statistics for power, duty cycle, maximum power and a peaks histogram. Statistics are accumulated in the dual-port RAM over successive FFT time intervals. After a certain number of FFT intervals, determined by a configurable value stored in the spectrum analyzer control registers, an interrupt is generated to output the stats from the dual-port RAM. For example, the stats are maintained in the dual-port RAM 2150 for 10,000 FFT intervals before the processor reads out the values. The power versus frequency data generated by the spectrum analyzer 2132 is also used as input to the signal detector.
The signal detector 2134 detects signal pulses in the frequency band and outputs pulse event information entries, which include one or more of the start time, duration, power, center frequency and bandwidth of each pulse that satisfies configurable pulse characteristic criteria associated with a corresponding pulse detector.
In the signal detector 2134, the peak detector 2136 looks for spectral peaks in the (power versus frequency data derived from FFT block output), and reports the bandwidth, center frequency and power for each detected peak. The output of the peak detector 2136 is one or more peaks and related information. The pulse detectors 2138 detect and characterize signal pulses based on input from the peak detector 2136.
The snapshot buffer 2140 collects a set of raw digital signal samples useful for signal classification and other purposes, such as time of arrival location measurements. The snapshot buffer 2140 can be triggered to begin sample collection from either the signal detector 2134 or from an external trigger source. The snapshot buffer 2140 can be triggered to begin sample collection from either the signal detector 2134 or from an external trigger source, such as a signal from the processor to capture received signal data for a period of time sufficient to include a series of signal exchanges used for location processing explained hereinafter. Alternatively, the snapshot buffer will be in a free-running state continuously storing captured and then in response to detecting the first signal (e.g., the Probe Request frame), the snapshot buffer is put into a post-store mode that extends long enough to capture the ACK frame signal data.
The traffic monitoring section 2500 monitors packet activity in wireless network, e.g., a WLAN, and sends and receives certain packets that are used for location measurement processes. For example, as described hereinafter, a sensor may transmit an 802.11 Probe Request frame, data frame or request-to-send frame that may be addressed to the device to be located. Included in the traffic monitoring section 2500 are a radio transceiver 2510 (comprising a transmitter Tx and a receiver Rx) and a baseband signal processor 2520. The radio transceiver 2510 and baseband signal processor 2520 may be part of a package chipset available on the market today, such as an 802.11 WLAN chipset for any one or more of the 802.1 la/b/g or other WLAN communication standards. The baseband signal processor 2520 is capable of performing the baseband modulation, demodulation and other PHY layer functions compliant with the one or more communication standards of interest (e.g., IEEE 802.1 la,b,g,h, etc.). An I/F 2530 couples the baseband signal processor 2520 and radio transceiver 2510 to the processor 2700.
There may be other traffic monitoring sections in the sensor to monitor communication protocol type activity of other types, such as Bluetooth™ communications.
The processor 2700 performs the various processing algorithms described herein on the output of the SAGE 2130 and on received packets from the traffic monitoring section 2500. The processor I/F 2160 of the spectrum monitoring section 2100 and the processor I/F 2530 of traffic monitoring section 2500 may be a Mini-PCI or PC-Card (e.g., Cardbus™) interface, or any other interface known in the art. While not shown in FIG. 2, there is also an LAN interface block (e.g., Ethernet) that is coupled to the processor 2700 to enable the sensor to communicate with the server with a wired LAN connection. The processor 2700 may generate signals to control the radio 2110 independently of the radio transceiver 2510, such that spectrum monitoring is occurring on one channel while protocol monitoring is simultaneously occurring on another channel, for example. It is envisioned that a WLAN AP may include all of the functionality of a sensor described above, and may be switched between AP operating mode and a sensor operating mode.
The Client-Server-Sensor Architecture
Turning to FIG. 3, a high level diagram is shown of the major functional blocks in the sensor 2000 and server 3000, as well as the interfaces between the sensor 2000 and server 3000, and between client applications 405 and the server 3000. In the sensor 2000, there are functions performed by the processor (executing one or more software programs) including a measurement engine 2710, a classification engine 2720, a location engine 2730 and a protocol engine 2740. The measurement engine 2710 and classification engine 2720 operate on RF data from the SAGE 2130. The location engine 2730 operates on raw received signal data obtained by the SAGE 2130 and the protocol engine 2740 operates on packet data generated by the baseband signal processor 2520.
The interface between the sensor 2000 and the server 3000 is referred to as a network spectrum interface (NSI) 2900. Examples of the messages that the sensor 2000 and server 3000 generate to implement the NSI 2900 are described in the aforementioned co-pending U.S. Application No. 60/508,635. The server 3000 may run on a dedicated server box, or it may be integrated with other servers such as WLAN switches, authentication servers or management servers. The server consist primarily of an application that implements several services or functions described hereinafter. There are high level services 3100, low level services 3200, and interface services 3300. The high level services 3100 include a database 3110, discovery manager 3120, performance manager 3130 and security manager 3140. The low level services 3200 are invoked by one or more or the high level services 3100 and include an RF manager 3210, location manager 3220 and protocol manager 3230. The interface services 3300 include an SNMP agent 3310, a Syslog interface 3320 and a web interface 3300. The server 3000 interfaces with the client applications 4005 by an application programming interface (API) called the intelligent spectrum management interface (ISMI) 3900. The functions provided by the server 3000 can be summarized as follows.
The server manages all of the sensors it communicates with. It aggregates data from the sensors, performs analysis on the data and presents the data in formats amenable to other network management entities. The server software analyzes the raw data primarily on three axes:
Discovery: Determine the complete set of spectrum emitting devices (e.g., 802.11 wireless network APs and STAs, and other non-802.11 compliant emitters) that are present and track their physical location of devices.
Performance: Analyze the spectrum, protocol, and location data in order to detect and mitigate performance problems. Examples include network load problems, frequency retransmissions, interference and cold spots.
Security: Analyze the spectrum, protocol, and location data in order to detect and mitigate security issues. Examples include rogue APs, ad hoc networks, perimeter breaches, denial of service attacks (protocol and RF level) and movement of otherwise designated stationary assets.
FIG. 4 illustrates the interaction between the server and the sensor in more detail, and the function of each of these blocks is described hereinafter. It should be understood that while only one sensor and one server are shown, a server 3000 communicates and aggregates data from one or several sensors 2000(1) to 2000(N).
The Sensor Software
Referring to FIG. 4 in conjunction with FIG. 5, the software functions of the sensor 2000 will be described in more detail. In addition to the measurement and classification engines 2710 and 2720, respectively, location engine 2730 and protocol engine 2740, the processor in the sensor also executes a station manager 2750 and an agent NSI 2760.
The measurement engine 2710 software in the sensor is responsible for communicating with the SAGE driver software to configure the SAGE 2130 in the sensor 2000. In addition, the measurement engine 2710 manages the resources of the SAGE 2130 between spectrum monitoring functions and device location functions. The measurement engine 2710 also collects and aggregates data from the SAGE 2130 into meaningful units. The functions of the measurement engine 2710 and classification engine 2720 may be incorporated into a single functional block. Furthermore, the measurement engine 2710 may configure reporting of data and statistics generated by the SAGE 2130 and adjust the frequency channel (and/or scan rate) on which the SAGE 2130 operates. The measurement engine 2710 may also operate the radio receiver in the sensor in a wideband mode to simultaneously process data across an entire unlicensed frequency band of interest. The classification engine 2720 classifies/identifies signals occurring in the frequency based on the output of the SAGE 2130. Examples of signals that the classification engine 2720 may identify include Bluetooth™ signals, microwave oven signals, cordless telephones, wireless headsets, radar, etc. Techniques for signal classification are described in greater detail in the aforementioned commonly assigned and co-pending U.S. Patent Applications. The classification engine 2720 may generate events (at a configurable update rate) associated with identified signals and may further make a generalized "air quality analysis" of the frequency band given the type of signals determined to be occurring in the frequency band. Examples of the statistics and events output by the measurement engine 2710 and classification engine 2720 are described hereinafter.
The location engine 2730 in the sensor is responsible for capturing raw received signal data used for time difference of arrival (TDOA) computations at the sensor. The location engine 2730 makes the TDOA computations and sends those computations to the server 3000 where the location computation is made based on multiple TDOA computations for a location process. In so doing, the location engine 2730 negotiates access to the snapshot buffer of the SAGE (to capture raw received signal data) by sending a request to the measurement engine 2710. The location engine 2730 initiates a location function in response to a Location Request (Loc Req) message from the server, and responds with the TDOA data in a Location Response (Loc Resp) message to the server. This process is described in more detail hereinafter.
The protocol engine 2740 captures information pertaining to packets transmitted over the air in accordance with a communication protocol, such as the IEEE 802.11 protocols. The baseband signal processor section of the sensor 2000 may operate in a "promiscuous mode" by which it can receive packets sent by any device on a particular 802.11 channel (but may not have access to the content of packets). In this manner, the sensor can develop statistics about the type of packets being sent, the volume of packet traffic, packet retransmissions, intruding APs or STAs, etc. Upon receiving a packet, the protocol engine 2740 collects statistics on the packet on a per channel, per device or per BSSID basis. Then, it applies a configurable (user-defined) filter to the packet for purposes of generating statistics. If the filter passes the packet it is sent to the server for further processing, otherwise it is bit bucketed. For example, the filter may be configurable with a Boolean expression of packet characteristics. Examples of the statistics and events output by the protocol engine 2740 are described hereinafter. The protocol engine 2740 is responsive to a service configuration (Config) message from the server to configure how to capture and report protocol information. In addition, the protocol engine 2740 performs functions to support location determination of other devices, such as scheduling the transmission of a reference packet that is used in TDOA location computations.
The protocol engine 2740 configures the process by which the sensor scans 802.11 channels to obtain packet information. The channel scan parameters may include channel selection, dwell time on the channel, hop pattern between channels, measurement intervals, etc. Finally, the protocol engine 2740 configures criteria for protocol-based asynchronous alerts associated with network performance or security, or sensor operational conditions according to corresponding threshold based alarm criteria. Examples of techniques useful for protocol-based intrusion detection and address spoofing are described in the paper entitled "Layer 2 Analysis of WLAN Discovery Applications for Intrusion Detection," Joshua Wright, November 18, 2002, and in the paper entitled "Detecting Wireless LAN MAC Address Spoofing," Joshua Wright, January 21, 2003. These papers are available from the Internet using a suitable search engine, and their entirety is incorporated herein by reference. The station manager 2750 software is responsible for storage and self- testing functions of the sensor. Specifically, the station manager provides persistent storage on a non- volatile memory of information pertaining to the individual sensor, including IP configuration, security keys used to authenticate the sensors to the server and vice-versa, sensor calibration data, software download information, and software version information.
The station manager 2750 also executes self-tests that are run when the sensor is powered on. Examples of functions or features that are tested include memory, chip detection, register read/write, LEDs, chip reset, interrupt tests and other board and chip level tests.
The agent NSI software 2780 manages the interface responsibilities for the sensor. It parses NSI messages received from the server to translate them into controls for one or more functions of the sensor, and generates messages containing data from one or more functions of the sensor. In addition, the agent NSI registers and de-registers software tasks for communication. A registering task can specify an interest in receiving events and from which sensor. Finally, the agent NSI supports the use of fixed compile time keys for authentication, or other more sophisticated security schemes. FIG. 5 shows other software blocks in the sensor 2000. An 802.11 user mode driver 2760 and an 802.11 device driver 2762 communicate with the traffic monitoring section of the sensor 2000. The SAGE user mode driver 2770, the SAGE radio control library 2772 and the SAGE device driver 2774 communicate with the spectrum monitoring section of the sensor 2000. The drivers referred to herein may sit on an embedded operating system (OS) 2780. In addition, to support wired LAN connectivity, there is an Ethernet driver (not shown) that sits on the OS 2780 in a similar manner to the 802.11 drivers.
The Server Software Similar to the agent NSI software, there is server NSI software 3250 in the server 3000 that is responsible for sending and receiving NSI messages, registering and de-registering software tasks including specifying which sensors the server is interested in receiving event information from as well as security support. The server NSI 3250 supports sensor management by notifying the sensor manager 3180 about the availability of sensors and the status of those sensors, e.g., sensor up/down type information. The server NSI 3250 also handles transport and socket management, and tasks related to setting up or tearing down the transport pipes, which may be socket-based. The server NSI 3250 supports requests from other server software (e.g. sensor manager) to open or close a connection to a sensor. The server NSI 3250 also processes a TCP connection, coming up or going down. The other server manager software functions that have registered to receive it are notified of this event. Alternatively, the down event may also be inferred from logic associated with activity over the transport pipe. The server NSI also configures discovery parameters for sensors (MAC address, port and interval). The higher level services 3100 of the server 3000 will now be described. The database 3110 provides physical storage of spectrum information, events, protocol information and related information generated by the sensors. In addition, the database 3110 maintains configuration information pertaining to the functions in the server 3000 and many functions in the sensors. A database schema is defined for the storage of this information, and is described hereinafter.
Discovery
The discovery manager 3120 in the server processes data pertaining to the discovery of new devices operating in the frequency band, such as 802.11 and other devices, and the physical location of those devices. Discovery involves handling reports from sensors concerning the up (and new) and down state of such devices. Also, multiple sensors may see the same 802.11 device coming up. The discovery manager 3120 detects suppresses the duplicate event. A discovery event associated with an 802.11 device may fall into one of the following classes: ours, known others, new and rogue. To this end, the discovery manager 3120 may maintain a list of authorized APs and STAs so that when a new device is detected by a sensor, the discovery manager 3120 can determine whether or not it is authorized.
Alternatively, the security manager, described hereinafter, could be the software process that maintains the list of authorized devices and determines the status of newly discovered devices.
Similarly, the discovery manager 3120 also processes data pertaining to known and unknown interferers and handles associated events including up, down, new, and duplicate suppression. The sensors report on new known and unknown interferer devices. Also, multiple sensors may see the same known and unknown interferer device coming up and the discovery manager suppresses the duplicate event.
The discovery manager 3120 executes a scan policy. When a new device is discovered and is in the management domain of the server, a request is made to the location manager 3220 to determine the location of the device.
Finally, the discovery manager 3120 handles event-action association. Given an event (e.g., when a new AP comes up), the discovery manager 3120 initiates one or a series of actions (i.e., check whether the server should manage that device, and if so, locate it, etc.).
Performance
The performance manager 3130 manages performance issues concerning the operation of wireless networks under the domain of the server in the shared frequency band. One such function is called an "air quality" analysis. Based on the air/spectrum quality reports that the server receives from the sensors (as described above), the performance manager generates an air quality analysis that may indicate to the user overall network and spectrum air quality. The air quality rating is an index that is calculated based on the average level of RF energy in a channel, number of frequency hopper signals present, and other factors. The presence and strength of frequency hopping signals in the channel is given significant weight on the overall quality measure of the channel. An air quality report may consist of:
1. The center frequency of the channel being reported on.
2. An aggregate index of the RF air quality in this channel. For example, 0 may be the best, 100 is the worst. Values 0 - 33 indicates "EXCELLENT", 34 - 66 indicates "GOOD" and 67 - 100 indicates POOR.
3. The percentage of time that the power level for the channel remains above a configurable threshold. 4. Number of hops per second of one or more frequency hopping signals in the whole channel. '0' indicates no appreciable hops. 5. Average power of one or more frequency hopping signals, in dBm 6. The maximum power generated by any devices which are producing constant (i.e., non-hopping) interference. The performance manager 3130 also sets a variety of thresholds which, if crossed, generates alarms. For example, an alarm may be generated if an AP has too many associated STAs, etc. The threshold cross alarms are described further hereinafter.
Security
The security manager 3140 in the server is responsible for managing security of one or more wireless networks operating in the frequency band under its domain. One type of security function is rogue AP detection. In rogue AP detection, a user can specify which APs are inside a security perimeter of the server and are authorized to operate in that security perimeter based on IP or MAC address. Sensors report the APs and STAs that they detect. The security manager 3140 processes these reports and determines whether an AP that is not authorized to operate inside the security perimeter has been detected. If so, then the security manager 3140 generates an alarm indicating the presence of a rogue AP. A sensor detects the presence of an AP. The security manager 3140 has the responsibility to declare the detected AP a rogue. A client user can specify the parameters of the security perimeter. The security manager 3140 configures the security perimeter accordingly, which may be a polygon or volume region specified by the user. Inside this perimeter are the devices that the user wants to protect. The security manager 3140 may generate an alert when a device physically located outside the security perimeter accesses a WLAN that is located inside the security perimeter. Conversely, the security manager 3140 may generate an alert when a device physically located inside the security perimeter accesses or sends data to a device outside the security perimeter or associates with an AP outside the security perimeter. Moreover, a client user can give a particular device operating within the domain of the server a "fixed location attribute." The security manager 3140 detects whenever that "fixed location" device moves and reports it or generates an alert. The security manager 3140 may also use trend information to detect "suspicious" protocol usage. A sequence of packets that meets certain filter characteristics might be deemed to be suspicious. For example, suspicious activity may be alerted when a sensor detects repeated attempts to associate with an AP using different MAC addresses. Alternatively, something more subtle that may be deemed suspicious is if a sensor detects packets from a particular STA that have non-sequential sequence numbers, potentially suggestive that a device user is masquerading as a particular STA. Another example is a probe packet that matches a signature of a well-known piece of hacker software such as NetStumbler. These types of activities need to be monitored at the sensor, since it requires examination of detailed packet traces. The security manager 3140 responds to suspicious protocol activity reports sent by sensors.
The low level services 3100 will now be described in more detail.
RF
The RF manager 3210 is responsible for aggregating and logging signal classification events from the classification engine 2720 in a sensor 2000, and for aggregating and logging spectrum statistics and raw spectrum information from the measurement engine 2710. The RF manager 3210 may also supply new or update existing classification templates or reference files to each sensor that the classification engine uses to classify RF signals.
Location
The location manager 3220 in the server handles the location processing to determine a location of a device operating in the frequency band. Location of a device (WLAN or interferer) can be a driving point for other analysis, particularly, security analysis. The location manager 3220 selects a group of sensors (e.g., 4 sensors) for a location measurement operation to locate a particular device. Each location operation usually needs several sensors working in concert. The location manager 3220 selects the subset sensors to be used in a location operation. Also, one of the sensors needs to be made a master, called the master reference terminal (MRT) sensor that transmits the reference signal used to solicit a response signal (second signal) from the device to be located or otherwise used as a reference with respect to the second signal transmitted by the device to be located. The other sensors, simply called reference terminals (RTs), capture the exchange of the first and second signals. An example of a location measurement process is disclosed in commonly assigned and co-pending U.S. Application No. 10/409,563, filed April 8, 2003 referred to above. The location manager 3220 dispatches location request messages to each of the sensors that are to be part of the location operation, and indicates in the message which sensor is the MRT. Each sensor generates TDOA information with respect to their respective receipt of the first and second signals and sends this information in a Loc Resp message to the location manager 3220. The location manager 3220 performs the final calculations from the TDOA information to compute the location of the device that is the subject of the location request. The location manager 3220 may have a configurable retry policy for a failed location operation. Location information may be generated in 2-dimensions or 3-dimensions, and displayed in either format as well.
The location manager 3220 also manages the scheduling of location requests, including the priority and the number of location requests that can be handled simultaneously. Any one sensor may be capable of handling a maximum number of location requests simultaneously. It may be desirable to assign priorities to a location request on a first come, first serve, or other basis.
The location manager 3220 caches location information and for example, indicates a "current as of x" type information associated with a computed location. Location information has a certain life span. The location manager 3220 may keep it current for a configurable period of time and then it is aged out and replaced with new location information.
The location manager 3220 may periodically execute a location process with certain sensors to determine the location of a particular device, e.g., a selected AP, and compare the measured location with a known location of the selected AP to verify that the sensors and server are performing the location operations correctly, and are operating within certain parameters. Protocol
The protocol manager 3230 in the server is responsible for logging the captured packets by the various sensors into a log file for later processing. There may be a time sync difference between sensors. Different sensors come up (power up) at different times and do not have a concrete time of day concept. They have a notion of ticks with respect to which the server software needs to normalize. For example, sensor 1 's tick 30 may represent the same instance of time as sensor 2's tick number 1000. The protocol manager software accounts for such skews.
The protocol manager 3230 may also provide aggregate packet statistic streams to a requesting client application. The protocol manager 3230 synchronizes the packet arrival from different sensors into a common time line. That is, packets captured at the same time in two different sensors may reach the server at a certain time skew. The protocol manager 3230 ensures that this time skew does not affect the packet traces. The protocol manager 3230 also detects when multiple sensors may see the same packet and report it to the server and remove the duplicate packet.
A set of filters may be used to configure background and real-time filtering of packets (as well as configuring the size of the background log) and are executed by the protocol manager 3230. Finally, the protocol manager 3230 converts protocol packet information into the appropriate format for transport via the ISMI 3900.
The sensor manager 3180 periodically polls the sensors to see if they are well and alive. In the event a sensor unexpectedly goes down, then during this keep alive polling process, the server determines when a sensor is not responding (for whatever reasons) and notes that sensor as "non-functional." The polling interval or frequency is configurable and the Sensor Manager manages this configuration.
The sensor manager 3180 performs a sensor discovery function by detecting when a sensor is coming up or going down. The server NSI provides the sensor manager 3180 with an indication about the sensor coming up or going down. The sensor manager 3180 then looks at the list of sensors that it has to manage and if that sensor is on the list, the sensor manager 3180 handles that event. In the event the sensor goes down, the sensor manager 3180 requests the server NSI 3250 to terminate the communication link with the sensor.
The sensor manager 3180 also sets up a connection with a sensor depending on whether the sensor coming up is in the server's domain or not. If the sensor coming up is in the server's domain (i.e., it has to be managed by the server) then the sensor manager 3180 requests the server NSI 3250 to set up a communication link with the sensor.
The sensor manager 3180 also has the responsibility of retrieving security keys for a sensor from the database and checking it against the key provided by the sensor. Only if they are identical should it allow the establishment of the communication link.
Finally, the sensor manager 3180 supports the configuration of topology information. This is the information about which sensors and device types the server manages. The server manager 3170 is responsible for internal server management.
For proper functioning of the server software, all the manager threads must be running and the server manager 3170 determines that the various manager software are operating properly. Server resources like CPU, memory are monitored and whenever it exceeds a pre-configured threshold, remedial actions are initiated. For example, if available memory becomes low, a garbage collection utility may be run to free up memory. In addition, the server manager 3170 performs an aging process that ages out old records in the database to free up memory in the event available memory becomes low.
The SNMP agent 3310 is responsible for SNMP related functions, such as SNMP user authentication, processing a database get request to retrieve the data from the database 3110 and returning it to the requesting entity. The SNMP agent 3310 performs trap support triggered by certain events. For example, in response to receiving an indication that a new sensor has come alive may cause the SNMP traps to be generated at the server. This will depend on the SNMP MLB definition. All tasks associated with MLB management are handled by the SNMP agent 3310. The SQL connector 3340 is responsible for publishing the database schema and controlling user access to the database. Some users may have read only access and others may have read and write access.
The web interface 3330 is responsible for the configuration interface for the overall system to allow a user to view and modify system configurations. In addition, the web interface 3330 processes some pertinent statistics and the results of that analysis are presented to the user in a report format. Finally, the web interface 3330 validates all configuration entries entered by a user. The web interface 3330 implements a server ISMI function and may support data in a variety of formats, including HTML or XML format.
The event manager 3150 receives events from sensors and dispatches the event information to other server software. Server managers register with the event manager 3150 to receive information on certain types of events.
The configuration manager 3160 pushes configurations to each sensor for initialization or configuration change. It also manages catastrophic event failure, scans policies of sensors and manages groups of 802.11 devices and sensors.
Now that the primary functions of the server 3000 have been described, set forth below is a list of the names of various tables in the database schema, followed by examples of the data structures for the tables. Many of these data structures are linked to each other as indicated. The fields in these data structures are similar to the data that the server makes available to a client application via the interface between the server and client applications described below. When the meaning of a field is obvious from its name, the description column indicates "self-evident."
Figure imgf000026_0001
Figure imgf000027_0001
Table: Air Quality Report Configurations (aqr_cfgs)
Figure imgf000027_0002
Tables referencing this one via Foreign Key Constraints: aqr_cfgs_channels Table: Air Quality Report Channel Configurations (aqr_cfgs_channels)
Figure imgf000027_0003
Table: Air Quality Report Statistics (aqr_stats)
Figure imgf000027_0004
Tables referencing this one via Foreign Key Constraints: aqr_stats_channels
Table: Air Quality Report Statistics Per Channel (aqr_stats_channels)
Figure imgf000027_0005
Figure imgf000028_0001
Table: BSSID Statistics (bssid stats)
These records are unique for NSI frequency and beacon interval.
F-Key Name Description id PRIMARYKEY sensors. fk ent id fk snsr ent id NOTNULL rxtime Timestamp without zone nsi_frequency Channel frequency in MHz nsι_premap Bitmap of Preambles used for Beacons nsι_ratemap Bitmap of Data Rates used for Beacons nsi nbeacon Number of Beacons received nsi nantenna Number of Beacons received over second sensor antenna nsi rssimm RSSI: Minimum value nsi rssimax RSSI: Maximum value nsi rssiave RSSI: Used for Average — Sum of RSSI nsi rssistd RSSI: Used for StdDev Sum of RSSIΛ2 nsi_nchange Number of Beacons that changed unexpectedly nsι_sqιmιn Signal Quality Index (SQI): Minimum value nsι_sqιmax SQI: Maximum value
Figure imgf000029_0001
Table: Channel Statistics (channel_stats)
Figure imgf000029_0002
Figure imgf000030_0001
Figure imgf000031_0001
Table: Classification Statistics (classification_stats)
Figure imgf000031_0002
Figure imgf000032_0001
Table: Classification Configurations (configuration_classifications)
Figure imgf000033_0001
Tables referencing this one via Foreign Key Constraints: configurations Table: Entity Maps Configurations (configuration_entity_maps)
Figure imgf000033_0002
Table: Configurations (configurations)
Figure imgf000033_0003
Tables referencing this one via Foreign Key Constraints: aqr_cfgs, configuration_entity_maps, database_cfgs, filter_cfgs, location_manager_cfgs, monitoring_policy_cfgs, performance_manager_cfgs, radio_cfgs, security_manager_cfgs, sensor_manager_cfgs, smc_info_cfgs
Table: Database Configurations (database_cfgs)
Figure imgf000033_0004
Table: 802.11 Devices (devices_80211)
Figure imgf000033_0005
Figure imgf000034_0001
Table: Entities (entities)
Figure imgf000034_0002
Tables referencing this one via Foreign Key Constraints: configuration_entity_maps, devices_80211, events, interferers, locations, sensors, servers, statuses, users
Table: Entity Classifications (entity_classifications)
Figure imgf000034_0003
Tables referencing this one via Foreign Key Constraints: entities, entity_type_categories, entity_types
Table: Entity Type Categories (entity_type_categories)
Figure imgf000034_0004
Tables referencing this one via Foreign Key Constraints: entity types Table: Entity Types (entity ypes)
Figure imgf000035_0001
Table: Event Types (event_types)
Figure imgf000035_0002
Tables referencing this one via Foreign Key Constraints: events Table: Events (events)
Figure imgf000035_0003
Table: Filter Configurations (filter cfgs)
Figure imgf000035_0004
Figure imgf000036_0001
Table: Interferers (interferers)
Figure imgf000036_0002
Table: Location Manager Configurations (location_manager_cfgs)
Figure imgf000036_0003
Figure imgf000037_0001
Table: Locations (locations)
Figure imgf000037_0002
Table: Monitoring Policy Configurations (monitoring_policy_cfgs)
Figure imgf000037_0003
The fields for the monitoring policy configurations data structure are the same as the fields for the Sensor Protocol Measurement Configuration, described below.
Table: Performance Manager Configurations (performance manager cfgs)
See the Performance Manager Configurations hereinafter for descriptions of some of these fields.
Figure imgf000037_0004
Figure imgf000038_0001
Figure imgf000039_0001
Table: Radio Configurations (radio cfgs)
Figure imgf000039_0002
Tables referencing this one via Foreign Key Constraints: radio_cfgs_bands Table: Radio Frequency Band Configurations (radio_cfgs_bands)
Figure imgf000039_0003
Table: Security Manager Configurations (security_manager_cfgs)
Figure imgf000039_0004
Figure imgf000040_0001
Table: Sensor Manager Configurations (sensor_manager_cfgs)
Figure imgf000040_0002
Table: Sensors (sensors)
Figure imgf000040_0003
Figure imgf000041_0001
Tables referencing this one via Foreign Key Constraints: aqr_stats, bssid_stats, channel stats, classification stats, interferers, locations, station stats
Table: Servers (servers)
Figure imgf000041_0002
Tables referencing this one via Foreign Key Constraints: sensors
Table: Measurement/Classifcation Engine Stream Configurations (smc_info_cfgs)
Some of these fields are described in the Spectrum Stream Configurations described hereinafter.
Figure imgf000041_0003
Figure imgf000042_0001
Table: Station Statistics (station_stats)
Figure imgf000042_0002
Figure imgf000043_0001
The foregoing is an example of a database scheme that is useful to manage configuration information for server and sensor functions and data collected from the sensors. The database 3110 populates the various database table structures with data collected from the sensors.
In addition to reporting events, the performance and security manager may initiate various actions to mitigate the impact of current RF conditions. For example, in response to a high level of interference on a given channel, the performance manager could configure 802.11 APs in the vicinity of the interference to operate on other channels.
To perform these type of responses, the performance and security manager make use of an action manager 3400. The action manager 3400 comprises logic to interface to the various types of wireless equipment that may be operating in the network. For example, some APs could be configured via an SNMP interface, some might be configured via a HTML interface, and some might use a proprietary interface. The action manager 3400 hides the details of these interfaces from the performance and security manager. Other actions may include changing the packet fragmentation threshold, assigning a device to a different frequency sub-band or channel in the frequency band, network load balancing (on the basis of channel frequencies or time), adjusting the transmit power of the AP, adjusting the communication data rate, executing interference mitigation or co-existence algorithms, executing spectrum etiquette procedures, executing spectrum priority schemes, or re-assigning STAs to APs in a WLAN. Examples of interference mitigation algorithms are disclosed in commonly assigned and co-pending U.S. Patent Publication No. 20020061031, published, May 23, 2002, and in U.S. Application No. 10/248,434, filed January 20, 2003, and entitled "Systems and Methods for Interference Mitigation with Respect to Periodic interferers in Short- Range Wireless Applications." FIG. 6 illustrates the interaction of some of the server applications in more detail. The server applications executes the functions described above in connection with FIGs. 4 and 5 and further include a message dispatcher 3500, a database manager 3112 and a Java database connectivity block (JDBC) 3114. Incoming spectrum and traffic/protocol data from the sensors is coupled to the message dispatcher 3500 that coordinates delivery of the data to the appropriate one of the other application services and to the database manager 3112 for registration and storage in the database. The web interface 3330 coordinates exchange of information with a web server 3600. The SNMP agent 3310 coordinates exchange of information with the various SNMP clients. The web server 3600 executes a server ISMI function to exchange controls and data with the various ISMI clients referred to above.
The ISMI
Whereas the NSI is used to interface control and information between the server and the sensors, the ISMI is an API that interfaces control and information between the server and the outside world, e.g., client users at a network management station, as well as to generate controls generated by the action manager 3400 to make adjustments to WLAN equipment based on activity determined to be occurring in the frequency band. The server implements a server ISMI (API) function (referred to above) to receive configurations from a client network management application and supplies data concerning activity in the wireless network and frequency band according to the configurations received from the client network management application. Conversely, a client application implements a client ISMI (API) function to supply configurations concerning the type of information requested about activity in the wireless network and frequency band, and receives from the server ISMI function data concerning activity in the wireless network and frequency band according to the configurations. Examples of the configurations supplied by the client ISMI function to the server ISMI function, and of the data supplied by the server ISMI function to the client ISMI function are described in the tables below.
The ISMI may support several data transports, such as streaming socket- based, Web, XML, SNMP, SQL Connector. It provides access to and configuration of raw streams for protocol, spectrum and location data; and periodic measurement data for protocol, spectrum and location data. In addition, it provides an interface for processed event streams, such as discovery events, performance events and security events. Examples of the ISMI configurations and data are set forth in the following tables. Much of this information is redundant to the information stored in the database of the server.
Server Configuration
The client is able to read and update the server configuration, which may include the following fields.
Figure imgf000045_0001
Server Status
The client is able to read the server status, which may include the following fields:
Figure imgf000046_0001
Sites and Zones
The server 3000 can support multiple sites each of which may be monitored by a set of sensors. A site has a defined zero location point. An example of a site would be a building. Within each site, a number of zones may be defined. A zone is marked by a physical perimeter, bounded by a set of location vertices which define a 3 -space polyhedron, for example.
Site Data
For each site, the client can read and update the following site configuration and status information.
Figure imgf000046_0002
Zone Data
For each zone, the client can read and update the following zone configuration and status information.
Figure imgf000047_0001
The client is able to request a list of existing sensors. The client may also create a new sensor entry and enable it, in order to expedite set-up of new sensors.
General Sensor Configuration
For each sensor, the client can read and update the following sensor configurations.
Figure imgf000047_0002
Figure imgf000048_0001
Sensor Location Measurement Configuration For each sensor, the client can read and update the following sensor location measurement configuration.
Figure imgf000048_0002
Sensor Spectrum Measurement and Classification Configuration For each sensor, the client can read and update the following sensor spectrum measurement and classification (SMC) configuration.
Figure imgf000048_0003
Sensor Protocol Measurement Configuration
For each sensor, the client can read and update the following sensor protocol measurement configuration.
Figure imgf000049_0001
Figure imgf000050_0001
Discovery Configuration
The client can read and update the following discovery configuration parameters.
Figure imgf000050_0002
Figure imgf000051_0001
Discovered Devices
The client is able to request a list of current or historical devices. If desired, the list can be qualified by the following filters:
Figure imgf000051_0002
For each device, the client can read and update the following device parameters.
Figure imgf000051_0003
Figure imgf000052_0001
The following additional location information is available. Note that in addition to current location, historical location records may be retrieved for a device:
Figure imgf000052_0002
For 802.11 devices, the following additional information may be available:
Figure imgf000052_0003
For interference devices, the following additional information may be available:
Figure imgf000052_0004
Figure imgf000053_0001
For frequency hopping interference devices, the following read-only detail information may be available:
Figure imgf000053_0002
For non-hopping interference devices, the following detail information may be available:
Figure imgf000053_0003
For continuous interference devices, the following read-only detail information is available:
Figure imgf000054_0001
The performance manager 3130 is responsible for generating alerts when 802.11 network performance has been or may be adversely affected.
Performance Configuration The client can read and update the following performance configuration parameters.
Figure imgf000054_0002
Figure imgf000055_0001
The client can configure threshold levels for various statistics that will result in generation of threshold crossing alarms (TCA) events. Simple thresholds may be set on individual statistics. For example, AQI < 25. In addition, complex thresholds may be set on combinations of statistics using Boolean rules. For example: AQI < 25 AND Max Power > 20.
SAGE thresholds can be set using the following statistics for a channel:
Figure imgf000055_0002
802.11 thresholds can be set using the following statistics for a channel, SSLD, or STA:
Figure imgf000055_0003
The security manager 3140 is responsible for generating alerts when 802.11 network security has been or may be adversely affected. Security Configuration
The client can read and update the following security configuration parameters.
Figure imgf000056_0001
Figure imgf000057_0001
The server 3000 generates an event stream which provides a high-level view of the operation of the system. The client is able to set a filter view for events, find the start and end index of available events, and retrieve a set of events.
Event filters provide a mechamsm for the client to receive only events that are of interest, while ignoring other events. Event filters may also be used to examine historical data for recurrences of specific events.
The client can read and update the following event filter parameters:
Figure imgf000057_0002
Figure imgf000058_0001
Events
An event has the following fields:
Figure imgf000058_0002
Event Configuration
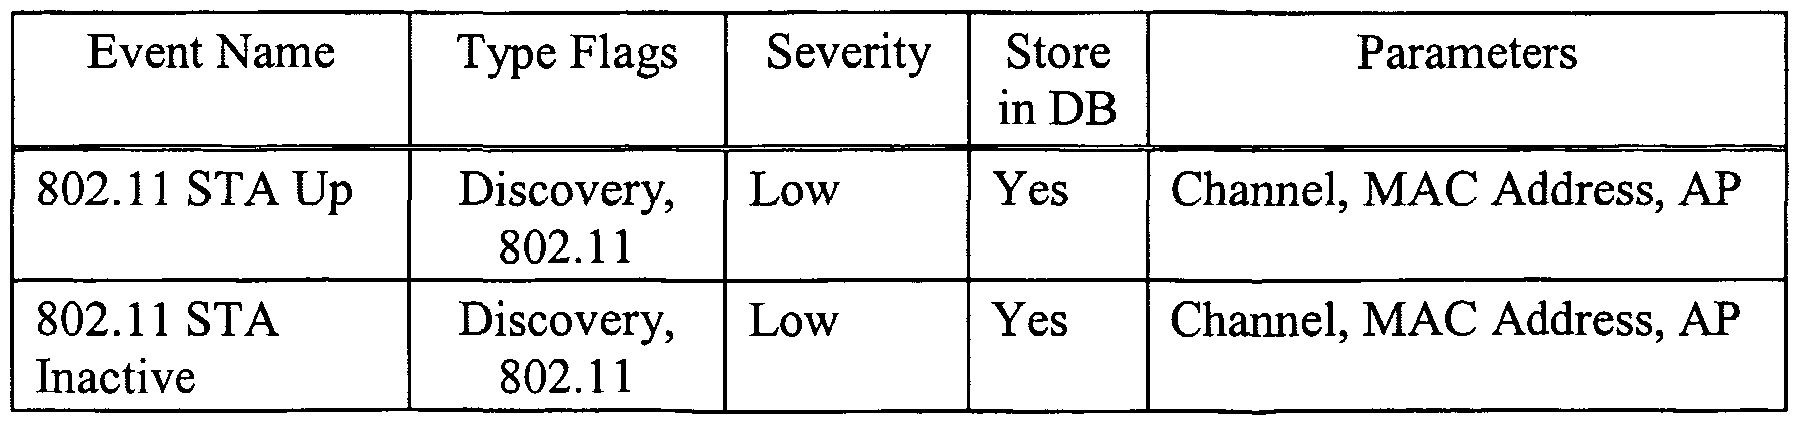
The following is a default list of events and their configurations. The client can read and update the event configuration to change the type flags, severity, or store in database attributes of a particular event.
Discovery events:
Figure imgf000058_0003
Figure imgf000059_0001
Security events:
Figure imgf000059_0002
Performance events:
Figure imgf000060_0001
The following system events are defined:
Figure imgf000060_0002
The server 3000 stores historical statistics data in a database. The client can query these statistics for presentation to users, or for post-analysis. The ISMI can set qualifiers for statistics, find the start and end time of available statistics data, and may retrieve a set of statistic data. For a set of statistic data, the client can specify the interval (start time, end time), and number of data points. For example, a client could query for the average AQI over the last week, with 50 data points.
Statistic Qualifiers
Statistic qualifiers enable the client to focus on a specific area of interest, for example a particular channel or location.
The client can read and update the following statistic qualifier parameters:
Figure imgf000061_0001
Statistic Data
The client can query data for the following statistics.
RF Statistics: These statistics may be qualified by channel and sensor.
Figure imgf000061_0002
802.11 Statistics:
These statistics may be qualified by channel, sensor, SSID, location, and specific devices.
Figure imgf000062_0001
Figure imgf000063_0001
Raw Location Data
En addition to receiving periodic location data via the discovered device interface, it may be desirable for a client to request immediate location operations. These immediate operations may even take place on devices that have not yet even been discovered by the server. An example is in the case of a client that is a location-based authentication system. En this case, a new 802.11 device has been powered on and wants to access the network. Because the device has just become active, it may not yet have been discovered by the server. n this case, the authentication server is able to request an immediate location operation. The following data is supplied by the client in order to "force discovery" of a device, and to perform an immediate location operation on the 802.11 device:
Figure imgf000063_0002
The "Associating with AP" field is used to determine the relative location of the device. This is important so that the proper sensors are used for the location operation. After the immediate location operation has taken place, the 802.11 device becomes part of the discovered set of devices. Its location (and other parameters) may be queried through the interface described above.
Raw Spectrum Data
The client may access a stream of raw SAGE spectrum data from any sensor. The measurement engine in the corresponding sensor generates this data. Spectrum Stream Configuration
The following fields are contained in a request from a client to configure a new raw spectrum stream for a particular sensor, and are also used to turn off an existing stream.
Figure imgf000064_0001
Figure imgf000065_0001
Spectrum Analyzer Power vs. Frequency (SAPF) The following fields describe the streaming data supplied by the server. This data provides a snapshot of data in the frequency spectrum, taken from a single Fast Fourier Transform (FFT) cycle. Within the selected frequency band, the bandwidth is divided into numSapfBins "bins", or frequency sub-bands. For each bin, and for each snapshot, this data reports on the power detected within that bin as measured in dBm.
Figure imgf000065_0002
Spectrum Analyzer Statistics The following fields are contained in the streaming data from the server. This data provide a statistical analysis of the data in the frequency spectrum. A single message is built from a specific number of Fast Fourier Transform (FFT) cycles. Statistics may be taken over a time period of 1/10 of a second for a single message. Typically, there are 256 frequency bins.
Figure imgf000066_0001
Each StatisticsDataBin has the following three sub-fields:
Figure imgf000066_0002
Pulse Events A pulse is a sustained emission of RF energy in a specific bandwidth starting at a specific time. The basic characteristics of an RF pulse are:
Start Time. Measured from when the sensor first begins detecting pulses.
Duration. The lifetime of the pulse.
Center Frequency. The center frequency of the pulse.
Bandwidth. How wide the pulse is.
Power. Average power in dBm. The overall structure of the pulse event (PEVT) data is shown below:
Figure imgf000067_0001
Each instance of the PulseEvents field describes the properties of one pulse.
Figure imgf000067_0002
Figure imgf000068_0001
Pulse Histograms
While it is possible to access information about specific pulses, it can be useful to work with the statistical information about the pulses that is provided by pulse histogram (PHIST) messages. The statistics provided by the NSI include:
The distribution of the duration of the pulses (the percentage of pulses with short, medium, and long durations).
The distribution of the gaps in time between the pulses (the percentage of pulses with short time gaps between them, medium time gaps, and long time gaps).
The distribution of pulses by bandwidth.
The distribution of pulses by frequency.
The distribution of pulses by power.
The overall structure of the PHIST data is shown in the following table:
Figure imgf000068_0002
Figure imgf000069_0001
Pulse Duration Histogram Each of the data bytes, or bins — in sequence — indicates the percentage (multiplied by two) of pulses that fall into a given range of durations.
Figure imgf000069_0002
Figure imgf000070_0001
Pulse Gap Histogram Format: pulseGapHistogram instead of measuring the width of pulses, each bin in sequence indicates the percentage (multiplied by two) of gaps between pulses, where the duration of the gap falls within a given time range. Gaps are measured between the start of one pulse and the start of the next. This is because the start of a pulse tends to be sharply delineated, while a pulse may trail off more gradually.
Figure imgf000070_0002
Pulse Bandwidth Histogram Each data byte, or bin, reflects a progressively wider bandwidth. The value stored in the bin is the percentage, multiplied times two, of the pulses that had a bandwidth somewhere within the indicated range. There are a total of 256 bins. En general, the Nth bin represents pulses with bandwidths between [(N - 1) * binSizeKHz], and [N * binSizeKHz]. Again, the value of the byte represents the % * 2 of pulses whose bandwidths fell within this range. There are SMC_PH1ST_N_FREQ_BENS {256} bins.
Pulse Center Frequency Histogram Each data byte, or bin, reflects a range of frequencies. The value stored in the bin is the percentage, multiplied times two, of the pulses whose center frequency fell within the indicated range of frequencies. The range of frequencies that are represented by each bin is determined by the user when this services is configured.
Pulse Power Histogram Each bin reflects a certain power range, measured in dBm. The value of each bin reflects the percentage, multiplied times 2, of those pulses whose power level fell within the indicated range. The range of each bin is SMC_PHIST_POWER_BIN_SIZE {5 } dBm, and the lowest power of the lowest bin is SMC_PHIST_MIN_POWER_DBM {-130} dBm. There are a total of SMC_PHIST N_POWER_BENS {30} bins.
Raw 802.11 Protocol Data The client is able to access a stream of filtered 802.11 packets from any sensor.
Protocol Stream Configuration The following fields are used in a request from a client to configure a raw protocol stream for a particular sensor, and are used to close an existing stream.
Figure imgf000072_0001
Protocol Stream Filtered Frame Data This data is used to send captured 802.11 frames that match the configured filter.
Figure imgf000072_0002
FIG. 7 is a ladder diagram that illustrates how the sensor and server coordinate for an exemplary process. The process 5000 of FIG. 7 is one involving detection and location of an unauthorized or "rogue" AP. In step 5010, at a sensor, the protocol engine sends periodic messages that include a list of APs and STAs that are detected from packets that the sensor receives. The messages from the protocol engine are forwarded in step 5020 to the discovery manager in the server. In step 5020, the discovery manager reads the list of information contained in the message from the sensor and generates an AP Up Event that is forwarded to the database to create/update a record. Next, an AP Up Event is forwarded, via the event manager, to the security manager in step 5040. En response to receiving an AP Up Event notice, in step 5050 the security manager polls the database to capture information about the AP associated with the AP Up Event, and compares an address or other identifier of the AP against a list of authorized APs to determine whether or not the AP is authorized. In step 5060, the security manager updates the records in the database to indicate whether or not the AP is authorized. In this example, it is assumed that the AP is not authorized, and such an indication is made in the database. En step 5070, the security manager generates an AP unauthorized event that is forwarded, via the event manager, to the discovery manager. In response to receiving a notification of the AP unauthorized event, in step
5080, the discovery manager sends a request to the location manager to locate the unauthorized AP. In step 5090, the location manager sends a location request message to the sensors (likely including the sensor that detected the unauthorized AP) to perform a location operation in order to determine the physical location of the AP. In step 5100, the location request message is forwarded by the NSI to the location engine in the respective sensors. The sensors perform the location operation and in so doing generate raw location data that is forwarded to the NSI in step 5110. En step 5120, the NSI forwards the raw location data (from each sensor) to the location manager. The location manager computes the location of the AP using the raw location data from each sensor and in step 5130 forwards the location information to the discovery manager. The discovery manager then forwards this information to the database manager to be added to the record for the unauthorized AP. At various steps along the process 5000 information may be passed out via the
ISMI to a client application or device. This is explained above in connection with the ISMI messages.
FIG. 8 shows a process 5200 in which an interfering signal (a signal interfering to an 802.11 WLAN) is detected and the source of the signal is located.
This process begins with the premise that the classification engine in a sensor has detected an interfering signal and has identified it. En step 5210, the classification engine sends an interfering (type) Up Event to the NSI. The NSI forwards the message in step 5220 to the discovery manager. In step 5230, the discovery manager sends a create record message to the database manager to create a record in the database for the detected interferer. When data is stored in the database for the interferer, the spectrum data (e.g., bandwidth, signal strength, center frequency(ies), duration, etc.) captured by the sensor that detected the interferer may also be stored in the record. Also, in step 5240, the discovery manager sends an interferer (type) Up Event message to the event manager. In step 5250, the discovery manager sends a request to the location manager to locate the source of the interferer. In step 5260, the location manager then sends a location operation request message to the sensors that are used for the location operation. In step 5270, the NSI forwards the location operation request message to the location engine in each sensor used for the location operation. After the sensor generates the raw location data, in step 5280, it forwards it to the NSI which in step 5290 forwards it to the location manager. The location manager computes the location of the interferer and forwards that information in step 5300 to the discovery manager. The discovery manager sends a message to the database manager to add the location data to the record for the interferer.
Though not shown in FIG. 8, it is further possible to obtain additional RF information about the interfering signal by "drilling down" to obtain spectrum statistics from the SAGE of the sensor(s) that detected and classified the interferer. The ISMI may be configured to deliver the spectrum data that was stored in the database record for the interferer either on demand in response to a request from a client application, or automatically upon discovery of the interferer. The spectrum data about the interferer may provide useful information to a network administrator in order to consider evasive or other mitigation actions. Alternatively, the client application may request from the sensor that detected the interferer, via the server, real-time spectrum data that includes more current and additional information about the interferer than what was stored in the database when the interferer was reported to the server.
Another use of location information obtained for a particular device or class of devices (e.g., WLAN STAs) is that information or content can be delivered to certain devices based on their physical location. As an example, in a museum setting, information describing a particular piece of art may be delivered based on a user's proximity to that piece. A similar location model can be used in merchandising applications, where information about a particular product or serviced is delivered to that user when the user's STA is in sufficient proximity to it. Conversely, location may be used to enforce policies that allow access to a wireless network when the device is in a certain region (e.g., visitor or reception area of an enterprise), but not in other areas (e.g., inside the company's facilities). Thus, a visitor having a laptop with WLAN connectivity may have access to a wireless network (to get Internet connectivity), but no (or limited) WLAN connectivity once inside the company's offices. In this latter case, the visitor's STA likely has an address or identifier that is not authorized to the company's WLAN management system, but the discovery manager and or server manager would be configured to permit the visitor's access to the WLAN only in the company's reception area, and only for Internet service.
Locating an IEEE 802.11 Device — Interaction Between Server and Sensors With reference to FIG. 4, the following is a description of the interaction between the location manager 3220 in the server and the location engine 2730 in sensors in the course of a location measurement operation. The Loc Req and Loc Resp messages referred to above are defined in more detail below. This description assumes that the server has already identified the sensors to be involved in the operation, including which sensor acts as the MRT sensor. In general, the sensor that acts as the MRT is the sensor that receives the signal of the device to be located with the strongest RSSI. 1. The location manager 3220 in the server 3000 sends a set-up message to each of the sensors 2000(i) that are to be used in the location process. The set-up message includes the address of the MRT, the frequency channel on which the signals used in the experiment will be on, and the address of the IEEE 802.11 device to be located (often called the target terminal (TT)).
2. Each of the sensors that receive the set-up message configures themselves to prepare for the location operation. In particular, the location engine 2730 requests access to the SAGE snapshot buffer resource via the measurement engine 2710. The snapshot buffer will be in a free-running state continuously storing captured signal data in a circular buffer fashion.
3. After each sensor configures itself in preparation for the location operation, the sensor sends a "ready" message back to the server advising it that it is ready for the operation. Alternatively, the sensors may send this message to the MRT sensor and the MRT sensor sends no such message.
4. If the ready messages from the sensors are sent to the server, the server sends a message to the MRT sensor advising it that it is safe to initiate the location operation. If the ready messages are sent directly to the MRT sensor, then this step is not necessary.
5. To execute the location operation, the MRT sensor sends a series of 802.11 frames. First, the MRT sensor sends a request-to-send (RTS) frame (first signal) addressed to the TT device. The TT device responds with a clear-to-send (CTS) frame (first response signal). After receiving the CTS frame, the MRT sensor sends a unicast Probe Request frame (second signal) to the TT device. The TT device responds to the Probe Request frame with an ACK frame (second response signal). This sequence of frames actually yields two pairs of TDOA measurements (between the RTS and CTS and between the Probe Request and ACK). During this frame exchange sequence, the MRT sensor and the RT sensors in the experiment receive these frames and store in their snapshot buffers the receive signal data (with reference to their own clocks) associated with the signals they received. In particular, the RT sensors are running their snapshot buffers in a continuous store mode and then in response to detecting the Probe Request frame, put their snapshot buffers into a post-store mode that extends long enough to capture the ACK frame. The snapshot buffer in the MRT sensor is continuously storing and stops storing in response to detecting an ACK frame, or timing out if no ACK frame is received. Each of the sensors examines the content of their snapshot buffers, and using the Probe Request frame as a unique reference point, look forward and backward (in time in the snapshot buffer) to identify the RTS/CTS exchange and to identify the ACK frame subsequent to the Probe Request. With the relevant data identified, the location engine 2730 in the sensors then uses suitable correlators to precisely determine the time of arrival of each of the frames, and from that information, determine the time difference of arrival (between the RTS and CTS for one TDOA data point, and between the Probe Request and ACK for another TDOA data point). 6. The sensors send the TDOA data back to the location manager 3220 of the server. The location manager 3220 in the server then performs the computations on the TDOA data to derive the location ofthe TT.
Locating a non-802.1 1 device (i.e., an interferer, such as a Bluetooth signal, microwave oven or cordless phone)
This process is different because the TT device does not respond to IEEE 802.11 frames. This process can be used for known interferers as well as interferers that are not known (such as may be the case for a device causing an RF level denial of service attack).
1. The location manager 3220 sends a set-up message to each of the sensors that are to be used in the location process, similar to the set- up message described above, except that it does not include the address of the TT device. Rather, it includes a message informing the MRT sensor to configure the pulse detector(s) in its SAGE block to generate a trigger signal upon detecting the TT signal. From previous transmission of the TT signal, the MRT sensor would already have classified the TT signal and is capable of configuring a pulse detector (in its SAGE block) to continue to detect it and generate a trigger signal in response thereto.
2. The sensors configure themselves, and send a ready signal to the server or MRT sensor. The MRT sensor is ready to initiate the location operation.
3. The MRT sensor transmits a Probe Request frame in response to detecting the TT signal. In doing so, the MRT sensor computes the time delay between receiving the TT signal and sending the Probe Request frame. The RT sensors continuously capture receive signal data and use the Probe Request frame data in the snapshot buffer as a marker for where to look back in the buffer for the TT signal. The RT sensors terminate further capturing of data a short period of time later upon detecting the Probe Request frame. The MRT sensor sends the time delay information it computed to the RT sensors so that the RT sensors can use it to locate the TT signal in their buffers with respect to the Probe Request frame.
4. The location engine 2730 in the MRT sensor and RT sensors then determine the time of arrival of the TT signal and the time of arrival of the Probe Request frame, and from that information compute the
TDOA data.
5. The sensors send the TDOA data to the location manager 3220 in the server 3000, where the location is computed based on the TDOA data. If the interfering signal is a signal that none of the sensors have a correlator for (in order to accurately determine the time of arrival of the device's signal transmissions), then one technique is to use as a reference waveform (a correlator) the receive signal sample data obtained at the RT sensor that best receives the interferer's signals. An example of this technique is disclosed in aforementioned commonly assigned U.S. Patent Application No. 60/469,647, filed May 12, 2003. FIG. 9 illustrates how a plurality of sensors 2000(1) to 2000(4) are deployed within an office environment and coupled to a server 3000. A network management station 4000, executing one or more network management client applications, is coupled to the server. The sensors 2000(1) to 2000(4) will detect the activity occurring in the frequency band and the network management station 4000 may generate a location map display that indicates locations of APs, STAs, no WLAN coverage areas, possible rogue devices, where interference devices, etc. In a multiple floor building, there may be similar configurations, and a single or multiple servers may couple to sensors deployed throughout the building, and servers associated with each building on a multi-building campus site may be coupled to a super server, as described above in conjunction with FIG. 1. Moreover, it is further envisioned that a super server may manage, via a WAN connection perhaps using the Internet, multiple servers associated with building sites at multiple geographic locations.
With reference to FIGs. 10-17 are diagrams depicting an example of a client application that consists of a graphical user interface (GUI) application to display data generated by the server and configure functions of the server.
The GUI application is referred to hereinafter as a console application and it has a launcher bar 6000 with indicators 6100 and buttons 6200 through 6240. The console application communicates with the server through the ISMI. The ISMI may be implemented in XML and SNMP. At any time, a user may access information on a WLAN and the surrounding RF environment by selecting any of the console's viewers: the event log viewer shown in FIGs. 11 and 12 is accessed via button 6200, the location map shown in FIGs. 13 and 14 is accessed via button 6210, the spectrum viewer shown in FIG. 15 is accessed via button 6220 and the protocol viewer shown in FIG. 16 is accessed via button 6230. The configuration button 6240 provides access to a configuration screen shown in FIG. 17.
The four status indicators 6100 (system, interference, performance and security) on the launcher bar are similar to the LEDs found on many electronic devices. Each indicator may have three colors: Green, Yellow, and Red. Any change in color indicates that a certain severity event has taken place.
As shown in FIGs. 11 and 12, the event log viewer maintains a running list of all WLAN and RF events, such as RF devices which have been turned on or off. FIG. 11 shows the list, and FIG. 12 shows the details of particular event selected from the list shown in FIG. 11. Each record in the event log display has the following fields: severity, flag, date and time, ED, and summary. The severity levels for an event are severe, major, minor, info, and debug and are explained as follows. Severe. The event may result in, or has resulted in, major failure of the
WLAN integrity. This may include an AP failure, or a security attack which is preventing network operations or compromising network security (such as a rogue AP, 802.11 device operating outside the security perimeter, and denial of service attack). Major. The WLAN is still running, but the event is causing or may cause a significant impact on network performance or security. This may include clients that have disappeared from the network without logging out, APs or clients running at very low data rates, major excess load on one or more channels, significant increases in RF interference and detection of potential security threats. Minor. The event represents an unusual behavior which may signal potential problems. Includes significant retransmissions of frames, moderate excess load on one or more channels, suspicious device movement and moderate increases in RF interference.
Enfo. The event is not judged to pose a significant concern to network security or performance.
Debug. These are specialized events that a user will not normally want to see, but that may need to see in order to identify a problem with the system itself. One or more flags indicate the general type of event: Discovery. A new device has been identified (may be an 802.11 device or an interferer). Security. The event has some impact on network security (for example, a rogue AP has been detected, or a device is transmitting without using WEP encryption).
Performance. There has been some significant change in WLAN performance.
System. The event reflects an issue with the system itself, such as sensor or server problems.
Spectrum. New or unusual RF activity has been detected. This is often associated with the discovery of a new interferer. Location. A device has been located, or a device has been moved.
802.11. The event concerns an 802.11 device, such as a new device joining the network, or an AP that is no longer functioning.
In FIGs. 13 and 14, the location map shows the location of all RF sources and facilitates configuring a security perimeter. By moving the cursor over an device icon on the map, the name, EP address and MAC address is displayed. FIG. 14 shows how a user may draw a security perimeter overlaid on the map.
FIG. 15 shows the how spectrum viewer displays raw RF spectrum and pulse data as detected by a specific sensor. A user can select which sensor's data is displayed. The protocol viewer displays both detailed and summary information on 802.11 frames which are detected by sensors in the system. Additional examples of the spectrum viewer displays are disclosed in commonly assigned and co- pending U.S. Application No. 10/420,515.
FIG. 16 illustrates how the protocol viewer displays protocol statistics. FIG. 17 illustrates a configuration dialog that enables a user to configure which types of events to be reported by the event log (e.g., 802.11 events, location events, performance events, security events, etc.); and the minimum severity of the events that will be shown (all events, minor problems, major problems, etc.). The configuration dialog and also allows a user to configure the kinds of plots displayed by the spectrum viewer. A user can choose which types of events to be shown on the event log. A single event will often have multiple flags. Moreover, a user can control both the types of events that should be displayed, and the level of severity associated with that event. In sum, a system is provided that monitors activity in a shared frequency band and on a wireless network that operates in the shared frequency band. The system comprises a server and a plurality of radio sensors that are coupled to the server and are positioned at various locations in a region where activity in a shared radio frequency band is occurring. Each of the plurality of radio sensors comprises a first radio receiver capable of receiving radio signals in a radio frequency band; a spectrum analysis system coupled to the radio receiver that produces spectrum activity information representative of the activity in the frequency band; a baseband signal processing section coupled to the first radio receiver that demodulates signals transmitted by other devices on a wireless network in the frequency band according to the communication protocol; a second radio receiver coupled to the baseband signal processing section that receives signals on the wireless network and couples received signals to the baseband signal processing section. The baseband signal processing section may be further capable of modulating signals in accordance with the communication protocol for transmission on the wireless network in the frequency band. In this latter case, the sensor further comprises a transmitter that transmits signals modulated by the baseband signal processing section.
A processor is coupled to the spectrum analysis system and to the baseband signal processing section, wherein the processor executes one or more programs to analyze packets transmitted by devices on the wireless network in the frequency band based on signals demodulated by the baseband signal processing section and to classify radio signals occurring in the frequency band based on the spectrum activity information output by the spectrum analysis system. The server receives data from each of the plurality of radio sensors and executes functions to process the data supplied by the plurality of sensors.
The server executes a the server executes a performance function that monitors and generates events related to the performance of the wireless network, a discovery function that monitors and generates events pertaining to devices operating in the wireless network or other radio frequency emitters in the frequency band and a security function that monitors and generates events related to security threats to the wireless network. In addition, the server interfaces data generated by its various functions to a client application, e.g., a network management application. The server is configurable by a network management application through an application programming interface (API) with respect to the type of information requested about activity in the wireless network and/or frequency band, and the server supplies aggregated data from the plurality of radio sensors to the network management application through the API.
Similarly, a method is provided for analyzing data pertaining to activity in a shared radio frequency band comprising steps of receiving data from each of a plurality of radio sensor devices deployed in different locations to detect activity in the radio frequency band, wherein the data includes identifiers types of signals determined to be occurring in the frequency band and statistics concerning traffic on wireless network operating in the radio frequency band; aggregating the data; and analyzing the data. The step of analyzing may comprise executing a performance function that monitors performance of the wireless network based on aggregated traffic statistics, executing a discovery function that monitors and generates events pertaining to devices operating in the wireless network or other radio frequency emitters in the frequency band, and executing a security function that monitors and generates events related to security threats to the wireless network. Further, a method is provided for interfacing a network management application with a plurality of radio sensor devices that monitor activity in a frequency band in which a wireless network and other interfering signal activity may be occurring, comprising steps of receiving configurations from the network management application concerning the type of information requested about activity in the wireless network and/or frequency band; and supplying data concerning activity in the wireless network and/or frequency band according to configurations. This corresponds to the ISMI API function executed by the server.
Likewise, a method is provided for interfacing a network management application with a plurality of radio sensor devices that monitor activity in a frequency band in which a wireless network and other interfering signal activity may be occurring, comprising generating configurations at the network management application concerning the type of information requested about activity in the wireless network and/or frequency band; and receiving data concerning activity in the wireless network and/or frequency band according to configurations. This corresponds to the ISMI API function executed by a client application. Similarly, this ISMI API function may be embodied by instructions encoded on a processor readable medium, that, when executed by processor (the processor running the client application), the processor performs the steps described above. Finally, this ISMI API function may be embodied as part of a system comprising the application program (the client application) and the application programming interface that executes the steps described above. The above description is intended by way of example only.

Claims

What is claimed is:
1. A radio sensor device comprising: a. a first radio receiver capable of receiving radio signals in a radio frequency band; b. a spectrum analysis system coupled to the first radio receiver that produces spectrum activity information representative of the activity in the frequency band; c. a baseband signal processing section that demodulates baseband signals transmitted by other devices on a wireless network in the frequency band according to a communication protocol; d. a second radio receiver coupled to the baseband signal processing section that receives signals transmitted on the wireless network and couples received signals to the baseband signal processing section; and e. a processor coupled to the spectrum analysis system and to the baseband signal processing section, wherein the processor executes one or more programs to analyze packets transmitted on the wireless network in the frequency band based on signals demodulated by the baseband signal processing section and to classify radio signals occurring in the frequency band based on the spectrum activity information output by the spectrum analysis system.
2. The radio sensor device of claim 1, wherein the spectrum analysis system produces spectrum activity information including pulse events representing occurrences of radio frequency pulses that match one or more criteria including one or more of bandwidth, duration and center frequency.
3. The radio sensor device of claim 1 , and further comprising a buffer that stores digital data derived from energy received by the first radio receiver for an interval of time.
4. The radio sensor device of claim 3, wherein the processor executes a program to trigger the buffer to capture the digital data associated with reception of a signal transmitted by a device to be located and a reference signal transmitted by another device, and from the digital data the processor computes a time difference of arrival at the sensor device of the signal transmitted by the device to be located and the reference signal.
5. The radio sensor device of claim 1, wherein the processor generates statistics about packets transmitted in the frequency band between devices in the wireless network including type of packets, volume of packet traffic, number of packet retransmissions and identifiers of devices transmitting packets.
6. The radio sensor device of claim 5, wherein the processor generates statistics on a received packets on a per channel, per device or per packet field identifier basis.
7. The radio sensor device of claim 5, wherein the processor filters packets to be analyzed for purposes of generating statistics.
8. The radio sensor device of claim 1, wherein the processor generates a quantity that represents a general quality of the frequency band based on the number and the type of signals that are determined to be occurring in the frequency band.
9. The radio sensor device of claim 1 , wherein the baseband signal processing section modulates signals in accordance with the communication protocol for transmission on the wireless network, and further comprising a transmitter coupled to the baseband signal processing section for transmitting signals modulated by the baseband signal processing section.
10. The radio sensor device of claim 9, wherein the processor controls the baseband signal processing section to modulate a reference signal in accordance with the communication protocol for transmission on the wireless network, wherein the reference signal is used in a process to locate a device operating in the frequency band.
11. The radio sensor device of claim 1, wherein the processor generates signals to control the first radio receiver and the second radio receiver independently of one another.
12. A system for monitoring activity in a shared frequency band, comprising: a. a plurality of radio sensors positioned at various locations in a region where activity in a shared radio frequency band is occurring, each of the plurality of radio sensors comprising: i. a first radio receiver capable of receiving radio signals in a radio frequency band; ii. a spectrum analysis system coupled to the first radio receiver that produces spectrum activity information representative of the activity in the frequency band; iii. a baseband signal processing section that demodulates baseband signals transmitted by other devices on a wireless network in the frequency band according to a communication protocol; iv. a second radio receiver coupled to the baseband signal processing section that receives signals transmitted on the wireless network and couples received signals to the baseband signal processing section; and v. a processor coupled to the spectrum analysis system and to the baseband signal processing section, wherein the processor executes one or more programs to analyze packets transmitted on the wireless network in the frequency band based on signals demodulated by the baseband signal processing section and to classify radio signals occurring in the frequency band based on the spectrum activity information output by the spectrum analysis system; and b. a server coupled to the plurality of radio sensors that receives data from each of the plurality of radio sensors and that executes functions to process the data supplied by the plurality of sensors.
13. The system of claim 12, wherein the server communicates with each of the plurality of radio sensors to configure parameters associated with generation of packet statistics and classification of signals by each radio sensor.
14. The system of claim 12, wherein the server configures the types of signals to be classified by one or more radio sensors.
15. The system of claim 12, wherein the baseband signal processing section modulates signals in accordance with the communication protocol for transmission on the wireless network, and further comprising a transmitter coupled to the baseband signal processing section for transmitting signals modulated by the baseband signal processing section.
16. The system of claim 15, wherein the processor controls the baseband signal processing section to modulate a reference signal in accordance with the communication protocol for transmission on the wireless network, wherein the reference signal is used in a process to locate a device operating in the frequency band.
17. The system of claim 12, wherein each of the radio sensors comprises a buffer that stores digital data derived from energy received by the first radio receiver for an interval of time.
18. The system of claim 17, wherein the server sends a location set-up message to a select group of radio sensors to prepare them for a location operation, wherein the message identifies the radio sensor that is to act as a master reference terminal and identifies the device to be located.
19. The system of claim 18, wherein in response to receiving the location set-up message from the server, the processor in each radio sensor in the select group executes a program to trigger the buffer to begin continuously capturing digital data associated with energy received by the radio receiver.
20. The system of claim 19, wherein in the master reference terminal sensor, the baseband signal processing section modulates signals in accordance with the communication protocol for transmission on the wireless network, and further comprising a transmitter coupled to the baseband signal processing section for transmitting signals modulated by the baseband signal processing section.
21. The system of claim 20, wherein the master reference terminal sensor transmits a first signal addressed to the device to be located, and in response thereto, the device to be located transmits a first response signal.
22. The system of claim 21, wherein in response to receiving the first response signal, the master reference terminal sensor transmits a second signal to the device to be located and the device to be located transmits a second response signal.
23. The system of claim 22, wherein the radio sensors in the select group and the master reference terminal sensor process the data captured by their buffers to determine the time of arrival of each of the signals and to compute the time difference of arrival between the first signal and the first response signal and between the second signal and the second response signal, and transmit the time difference of arrival data to the server.
24. The system of claim 22, wherein the device to be located is a device compatible with the IEEE 802.11 standards, and wherein master reference terminal sensor transmits the first signal as a request-to- send (RTS) frame and the first response signal is a clear-to-send (CTS) frame, and the master reference terminal sensor transmits the second signal as a Probe Request frame to the device to be located and the second response signal is an ACK frame.
25. The system of claim 21, wherein the radio sensors in the select group and the master reference terminal sensor process the data captured by their buffers to determine the time of arrival of each of the signals and to compute the time difference of arrival between the first signal and the first response signal, and transmit the time difference of arrival data to the server.
26. The system of claim 21, wherein the server computes the location of the device to be located based on the time difference of arrival data received from the select group of radio sensors.
27. The system of claim 21, wherein the device to be located is a device compatible with the IEEE 802.11 standards, and wherein master reference terminal sensor transmits the first signal as a request-to- send (RTS) frame and the first response signal is a clear-to-send (CTS) frame.
28. The system of claim 12, wherein the server aggregates the data from the plurality of radio sensors and formats portions of the data for interface to a network management application.
29. The system of claim 12, wherein the server stores data from the plurality of radio sensors in a database.
30. The system of claim 29, wherein the server stores in the database configuration information associated with functions of the server and the radio sensors and data generated by the plurality of radio sensors.
31. The system of claim 29, wherein the server stores data from the radio sensors in a plurality of interrelated data structures.
32. The system of claim 31 , wherein the server stores data pertaining to the signals determined to be occurring in the frequency band by one or more radio sensors in a classification statistics data structure containing data about the signal in fields including a device-ON indicator, a classification identifier that identifies a device type, a product identifier that identifies a specific product and a confidence measure that indicates a certainty of the classification identifier.
33. The system of claim 31, wherein the server stores data pertaining to signals that are interferers to the wireless network determined to be occurring in the frequency band in an interferer data structure in fields that include a device-ON indicator, a classification identifier that identifies a device type, a product identifier that identifies a specific product and a confidence measure that indicates a certainty of the classification identifier.
34. The system of claim 29, wherein the server stores data associated with events occurring in the frequency band and/or wireless network in an event data structure and an event types data structure that is linked to the event data structure.
35. The system of claim 34, wherein the server stores data in the event types data structure in fields including one or more of name, severity level, summary and description.
36. The system of claim 12, wherein the server executes a performance function that monitors and generates events related to the performance of the wireless network, a discovery function that monitors and generates events pertaining to devices operating in the wireless network or other radio frequency emitters in the frequency band and a security function that monitors and generates events related to security threats to the wireless network.
37. The system of claim 36, wherein the server further executes a location function that communicates with a select group of radio sensors to obtain data from the select group of radio sensors that the location function uses to determine locations of wireless network and other radio frequency emitters in the frequency band; a protocol manager function that aggregates packet statistics generated by the radio sensors; and a radio frequency manager function that aggregates spectrum activity information and signal classification information generated by the radio sensors.
38. The system of claim 37, wherein the server executes the discovery function to interact with the location function in order to obtain a location of a wireless network device other radio frequency emitters determined by the discovering manager to be discovered by a radio sensor.
39. The system of claim 37, wherein the server executes the security function to interact with the location function in order to obtain a location of a wireless network device or other radio frequency emitters that pose a security threat to the wireless network.
40. The system of claim 37, wherein the server executes the performance function to interact with the protocol manager function to monitor packet activity in the wireless network for security threats.
41. The system of claim 36, wherein the performance function, discovery function and security function are configurable with respect to the types of activity they monitor in the data supplied by the location function, protocol manager function and radio frequency manager function.
42. The system of claim 12, wherein the processor in at least one radio sensor generates a measurement of the general quality of the frequency band in its proximity based on the number and type of signals determined to be occurring in the frequency band.
43. The system of claim 12, wherein the server manages information pertaining to a building site in which a plurality of radio sensors are located, and a plurality of zones within the building site in which one or more radio sensors are located.
44. The system of claim 43, wherein based on data collected from the plurality of radio sensors, the server generates for each zone, an indication of one or more of a degree of severity of interfering signal activity, wireless network performance level, and security status of the wireless network.
45. The system of claim 44, and further comprising a plurality of servers each coupled to an associated plurality of radio sensors, and a super server coupled to the plurality of servers to manage the plurality of servers.
46. The system of claim 12, wherein the server generates a list of devices discovered in the frequency band based on the signals determined to be occurring in the frequency band by the plurality of radio sensors.
47. The system of claim 46, wherein the server generates, for each device discovered in the frequency band, information selected from the group consisting of: an identifier of the type of device (interferer or wireless network), time that the device is discovered, time the device is determined to no longer be present, identifier of the one or more radio sensor(s) that discovered the device, physical location of the device and the time at which the location was determined and indication of movement of a device that was designated as a fixed location device.
48. The system of claim 46, wherein the server generates, for each device that is discovered and determined to be an interferer to the wireless network, information selected from the group consisting of: general classification of the device, specific product type if it has been determined, measure of confidence that the classification and/or specific product type are accurate, alternate classification and specific product types and associated measure of confidences, type of device including frequency hopping, non-frequency hopping and continuous signal.
49. The system of claim 12, wherein the server configures thresholds for statistics derived from the data supplied by the radio sensors, which when crossed, the server generates an alarm event.
50. The system of claim 49, wherein the server configures a threshold for one or more of the following statistics derived from data generated by the radio sensors: number of interfering signals occurring in a channel, percentage of time that the power level for a channel remains above a power threshold, number of radio frequency pulses occurring in a channel during a measurement interval, a measurement of the general quality of a channel based on the number and type of interfering signals to the wireless network determined to be occurring in the frequency band.
51. The system of claim 12, wherein the server generates events associated with activity detected in the wireless network and/or frequency band.
52. The system of claim 51 , wherein the server generates information indicating an event type, wherein the event type is selected from the group consisting of: discovery of a new device, performance of the wireless network, security of the wireless network and location of a device.
53. The system of claim 52, wherein for an event related to a security issue, the server generates an indication of the type of security issue selected from the group consisting of: a device accessing the wireless network from an unauthorized location, the type of device accessing the wireless network from an unauthorized location, an unauthorized access point operating on the wireless network, a protocol level denial of attack on the wireless network and a radio signal level denial of attack on the wireless network characterized by a radio signal of a relatively long duration across a substantial portion of the frequency band.
54. The system of claim 53, wherein the server generates for each event information selected from the group consisting of: an identifier of the type of event, a timestamp associated with the time that the event occurred, a list of the radio sensors that detected the event, an identifier for the site in which the event occurred, an identifier for a zone in the site in which the event occurred and an indication of the severity of the event.
55. The system of claim 12, wherein the server is configurable by a network management application through an application programming interface (API) with respect to the type of information requested about activity in the wireless network and/or frequency band, and the server supplies data from the plurality of radio sensors to the network management application through the APE.
56. A method for interfacing a network management application with a plurality of radio sensor devices that monitor activity in a frequency band in which a wireless network and other interfering signal activity may be occurring, comprising steps of: a. receiving configurations from the network management application concerning the type of information requested about activity in the wireless network and/or frequency band; and b. supplying data concerning activity in the wireless network and/or frequency band according to configurations.
57. The method of claim 56, wherein the step of receiving configurations comprises receiving configuration parameters concerning types of interfering signals to be detected in the frequency band and parameters about traffic activity in the wireless network.
58. The method of claim 56, wherein the step of supplying data comprises supplying a generalized description of the quality of the frequency band based on the number and type of interfering signals determined to be occurring in the frequency band or in a particular channel of the frequency band.
59. The method of claim 56, wherein the step of supplying data comprises supplying a list of devices discovered in the frequency band.
60. The method of claim 59, wherein the step of supplying data comprises supplying, for each device discovered in the frequency band, information selected from the group consisting of: an identifier of the type of device (interferer or wireless network), time that the device is discovered, time the device is determined to no longer be present, identifier of the sensor or sensors that discovered the device, physical location of the device and the time at which the location was determined and indication of movement of a device that was designated as a fixed location device.
61. The method of claim 60, wherein the step of supplying data comprises supplying, for each device that is discovered and determined to be an interferer to the wireless network, information selected from the group consisting of: general classification of the device, specific product type if it can be determined, measure of confidence that the classification and/or specific product type are accurate, alternate classification and specific product types and associated measure of confidences, type of device including frequency hopping, non-frequency hopping and continuous signal.
62. The method of claim 56, wherein the step of receiving configurations comprises receiving information describing thresholds for statistics derived the data supplied by the radio sensor ' devices, which when crossed, causes generation of an alarm event.
63. The method of claim 62, wherein the step of receiving configurations comprises receiving a threshold for one or more of the following statistics derived from data generated by the radio sensor devices: number of interfering signals occurring in a channel, percentage of time that the power level for a channel remains above a power threshold, number of radio frequency pulses occurring in a channel during a measurement interval, a measurement of the general quality of a channel based on the number and type of interfering signals to the wireless network determined to be occurring in the frequency band.
64. The method of claim 56, wherein the step of supplying data comprises supplying event alerts associated with activity detected in the wireless network and/or frequency band.
65. The method of claim 64, wherein the step of supplying data comprising supplying information indicating the type of event alert, wherein the event type is selected from the group consisting of: discovery of a new device, performance of the wireless network, security of the wireless network and location of a device.
66. The method of claim 65, wherein the step of supplying data comprises supplying for an event related to a security issue an indication of the type selected from the group consisting of: a device accessing the wireless network from an unauthorized location, the type of device accessing the wireless network from an unauthorized location, an unauthorized access point operating on the wireless network, a protocol level denial of attack on the wireless network and a radio signal level denial of attack on the wireless network characterized by a radio signal of a relatively long duration across a substantial portion of the frequency band.
67. The method of claim 66, wherein the step of supplying data comprises generating for each event information selected from the group consisting of: an identifier of the type of event, a timestamp associated with the time that the event occurred, a list of the radio sensor devices that detected the event, an identifier for the site in which the event occurred, an identifier for a zone in the site in which the event occurred and an indication of the severity of the event.
68. A method for interfacing a network management application with a plurality of radio sensor devices that monitor activity in a frequency band in which a wireless network and other interfering signal activity may be occurring, comprising steps of: a. generating configurations at the network management application concerning the type of information requested about activity in the wireless network and/or frequency band; and b. receiving data concerning activity in the wireless network and/or frequency band according to configurations.
69. The method of claim 68, wherein the step of generating configurations comprises generating configuration parameters concerning types of interfering signals to be detected in the frequency band and parameters concerning statistics pertaining to traffic in the wireless network.
70. The method of claim 69, wherein the step of receiving data comprises receiving a generalized description of the quality of the frequency band based on the number and type of interfering signals determined to be occurring in the frequency band or in a particular channel of the frequency band.
71. The method of claim 69, wherein the step of receiving data comprises receiving a list of devices discovered in the frequency band.
72. The method of claim 71, wherein the step of receiving data comprises receiving, for each device discovered in the frequency band, information selected from the group consisting of: an identifier of the type of device (interferer or wireless network), time that the device is discovered, time the device is determined to no longer be present, identifier of the one radio sensor devices that discovered the device, physical location of the device and the time at which the location was determined and indication of movement of a device that was designated as a fixed location device.
73. The method of claim 72, wherein the step of receiving data comprises receiving, for each device that is discovered and determined to be an interferer to the wireless network, information selected from the group consisting of: general classification of the device, specific product type if it can be determined, measure of confidence that the classification and/or specific product type are accurate, alternate classification and specific product types and associated measure of confidences, type of device including frequency hopping, non-frequency hopping and continuous signal.
74. The method of claim 69, wherein the step of generating configurations comprises generating information describing thresholds for statistics derived the data supplied by the radio sensor devices, which when crossed, causes generation of an alarm event.
75. The method of claim 74, wherein the step of generating configurations comprises designating a threshold for one or more of the following statistics derived from data generated by the radio sensor devices: number of interfering signals occurring in a channel, percentage of time that the power level for a channel remains above a power threshold, number of radio frequency pulses occurring in a channel during a measurement interval, a measurement of the general quality of a channel based on the number and type of interfering signals to the wireless network determined to be occurring in the frequency band.
76. A processor readable medium encoded with instructions that, when executed by a processor, cause the processor to perform steps of: generating configurations concerning the type of information requested about activity in a wireless network and in a frequency band in which the wireless network operates; and receiving data containing information concerning activity in the wireless network and frequency band according to the configurations.
77. A method for analyzing data pertaining to activity in a shared radio frequency band comprising steps of: a. receiving data from each of a plurality of radio sensor devices deployed in different locations to detect activity in the radio frequency band, wherein the data includes identifiers types of signals determined to be occurring in the frequency band and statistics concerning traffic on wireless network operating in the radio frequency band; b. aggregating the data; and c. analyzing the data.
78. The method of claim 77, wherein the step of analyzing comprises executing a performance function that monitors performance of the wireless network based on aggregated traffic statistics, executing a discovery function that monitors and generates events pertaining to devices operating in the wireless network or other radio frequency emitters in the frequency band, and executing a security function that monitors and generates events related to security threats to the wireless network.
PCT/US2003/036866 2002-11-27 2003-11-19 Server and multiple sensor system for monitoring activity in a shared radio frequency band WO2004051868A2 (en)

Priority Applications (1)

Application Number Priority Date Filing Date Title
AU2003291065A AU2003291065A1 (en) 2002-11-27 2003-11-19 Server and multiple sensor system for monitoring activity in a shared radio frequency band

Applications Claiming Priority (16)

Application Number Priority Date Filing Date Title
US31973702P 2002-11-27 2002-11-27
US60/319,737 2002-11-27
US10/409,563 US20050003828A1 (en) 2002-04-09 2003-04-08 System and method for locating wireless devices in an unsynchronized wireless environment
US10/409,563 2003-04-08
US10/420,515 US7424268B2 (en) 2002-04-22 2003-04-22 System and method for management of a shared frequency band
US10/420,515 2003-04-22
US46964703P 2003-05-12 2003-05-12
US60/469,647 2003-05-12
US50294703P 2003-09-16 2003-09-16
US60/502,947 2003-09-16
US50863603P 2003-10-03 2003-10-03
US50863503P 2003-10-03 2003-10-03
US60/508,635 2003-10-03
US60/508,636 2003-10-03
US51138303P 2003-10-15 2003-10-15
US60/511,383 2003-10-15

Publications (2)

Publication Number Publication Date
WO2004051868A2 true WO2004051868A2 (en) 2004-06-17
WO2004051868A3 WO2004051868A3 (en) 2004-10-28

Family

ID=32475937

Family Applications (1)

Application Number Title Priority Date Filing Date
PCT/US2003/036866 WO2004051868A2 (en) 2002-11-27 2003-11-19 Server and multiple sensor system for monitoring activity in a shared radio frequency band

Country Status (2)

Country Link
AU (1) AU2003291065A1 (en)
WO (1) WO2004051868A2 (en)

Cited By (13)

* Cited by examiner, † Cited by third party
Publication number Priority date Publication date Assignee Title
US20130148547A1 (en) * 2011-12-13 2013-06-13 John M. Page Method and system for collecting topology information
US8537772B2 (en) 2009-07-02 2013-09-17 Qualcomm Incorporated Transmitter quieting during spectrum sensing
US8780982B2 (en) 2009-07-02 2014-07-15 Qualcomm Incorporated Transmitter quieting and different encoding rates for portions of a set of frames
US8902995B2 (en) 2009-07-02 2014-12-02 Qualcomm Incorporated Transmitter quieting and reduced rate encoding
US8958475B2 (en) 2009-07-02 2015-02-17 Qualcomm Incorporated Transmitter quieting and null data encoding
US9112618B2 (en) 2009-07-02 2015-08-18 Qualcomm Incorporated Coding latency reductions during transmitter quieting
CN105578488A (en) * 2014-10-10 2016-05-11 中兴通讯股份有限公司 Network data acquisition system and network data acquisition method
WO2016112006A1 (en) * 2015-01-07 2016-07-14 Passport Systems, Inc. Intelligent server in a system of networked sensors
EP2115910B1 (en) * 2007-01-04 2017-08-30 QUALCOMM Incorporated Method and apparatus for distributed spectrum sensing for wireless communication
WO2017144397A1 (en) * 2016-02-26 2017-08-31 Ghmt Ag System for monitoring, controlling, analyzing performance and/or tracing malfunctions in wlans
US10212231B2 (en) 2015-01-07 2019-02-19 Passport Systems, Inc. Methods and systems for detecting a material source using a server and networked sensors
US10516968B2 (en) 2014-12-10 2019-12-24 Qualcomm Incorporated Techniques for determining a position fix of an object using one or more mobile devices co-located with the object
CN113543094A (en) * 2015-07-08 2021-10-22 联邦快递服务公司 Event monitoring of event candidates related to ID nodes in a wireless node network

Citations (4)

* Cited by examiner, † Cited by third party
Publication number Priority date Publication date Assignee Title
US5930733A (en) * 1996-04-15 1999-07-27 Samsung Electronics Co., Ltd. Stereophonic image enhancement devices and methods using lookup tables
US6131013A (en) * 1998-01-30 2000-10-10 Motorola, Inc. Method and apparatus for performing targeted interference suppression
US20030021237A1 (en) * 2001-06-08 2003-01-30 Min Jonathan S. Receiver having integrated spectral analysis capability
US20030050070A1 (en) * 2001-03-14 2003-03-13 Alex Mashinsky Method and system for dynamic spectrum allocation and management

Patent Citations (4)

* Cited by examiner, † Cited by third party
Publication number Priority date Publication date Assignee Title
US5930733A (en) * 1996-04-15 1999-07-27 Samsung Electronics Co., Ltd. Stereophonic image enhancement devices and methods using lookup tables
US6131013A (en) * 1998-01-30 2000-10-10 Motorola, Inc. Method and apparatus for performing targeted interference suppression
US20030050070A1 (en) * 2001-03-14 2003-03-13 Alex Mashinsky Method and system for dynamic spectrum allocation and management
US20030021237A1 (en) * 2001-06-08 2003-01-30 Min Jonathan S. Receiver having integrated spectral analysis capability

Cited By (19)

* Cited by examiner, † Cited by third party
Publication number Priority date Publication date Assignee Title
EP2115910B1 (en) * 2007-01-04 2017-08-30 QUALCOMM Incorporated Method and apparatus for distributed spectrum sensing for wireless communication
US10069591B2 (en) 2007-01-04 2018-09-04 Qualcomm Incorporated Method and apparatus for distributed spectrum sensing for wireless communication
US8958475B2 (en) 2009-07-02 2015-02-17 Qualcomm Incorporated Transmitter quieting and null data encoding
US8537772B2 (en) 2009-07-02 2013-09-17 Qualcomm Incorporated Transmitter quieting during spectrum sensing
US9112618B2 (en) 2009-07-02 2015-08-18 Qualcomm Incorporated Coding latency reductions during transmitter quieting
US8780982B2 (en) 2009-07-02 2014-07-15 Qualcomm Incorporated Transmitter quieting and different encoding rates for portions of a set of frames
US8902995B2 (en) 2009-07-02 2014-12-02 Qualcomm Incorporated Transmitter quieting and reduced rate encoding
US20130148547A1 (en) * 2011-12-13 2013-06-13 John M. Page Method and system for collecting topology information
US9397895B2 (en) * 2011-12-13 2016-07-19 Viavi Solutions Inc. Method and system for collecting topology information
US9942101B2 (en) 2011-12-13 2018-04-10 Viavi Solutions Inc. Method and system for collecting topology information
CN105578488A (en) * 2014-10-10 2016-05-11 中兴通讯股份有限公司 Network data acquisition system and network data acquisition method
CN105578488B (en) * 2014-10-10 2020-10-16 南京中兴软件有限责任公司 Network data acquisition system and method
US10516968B2 (en) 2014-12-10 2019-12-24 Qualcomm Incorporated Techniques for determining a position fix of an object using one or more mobile devices co-located with the object
EP3243192A4 (en) * 2015-01-07 2018-09-19 Passport Systems, Inc. Intelligent server in a system of networked sensors
US10212231B2 (en) 2015-01-07 2019-02-19 Passport Systems, Inc. Methods and systems for detecting a material source using a server and networked sensors
WO2016112006A1 (en) * 2015-01-07 2016-07-14 Passport Systems, Inc. Intelligent server in a system of networked sensors
CN113543094A (en) * 2015-07-08 2021-10-22 联邦快递服务公司 Event monitoring of event candidates related to ID nodes in a wireless node network
WO2017144397A1 (en) * 2016-02-26 2017-08-31 Ghmt Ag System for monitoring, controlling, analyzing performance and/or tracing malfunctions in wlans
US11109248B2 (en) 2016-02-26 2021-08-31 Ghmt Ag System for monitoring, controlling, analyzing performance and/or tracing malfunctions in WLANs

Also Published As

Publication number Publication date
AU2003291065A8 (en) 2004-06-23
AU2003291065A1 (en) 2004-06-23
WO2004051868A3 (en) 2004-10-28

Similar Documents

Publication Publication Date Title
US7184777B2 (en) Server and multiple sensor system for monitoring activity in a shared radio frequency band
US7444145B2 (en) Automated real-time site survey in a shared frequency band environment
US7460837B2 (en) User interface and time-shifted presentation of data in a system that monitors activity in a shared radio frequency band
US8175539B2 (en) System and method for management of a shared frequency band
US7408907B2 (en) System and method for management of a shared frequency band using client-specific management techniques
EP1502369B1 (en) Device and method for management of a shared frequency band
US7295524B1 (en) Methods, apparatuses and systems facilitating management of airspace in wireless computer network environments
US20060128311A1 (en) Matching receive signal strenth data associated with radio emission sources for positioning applications
US7142108B2 (en) System and method for monitoring and enforcing a restricted wireless zone
US9137670B2 (en) Method for detecting rogue devices operating in wireless and wired computer network environments
US8086227B2 (en) Collaboratively locating disconnected clients and rogue access points in a wireless network
WO2004051868A2 (en) Server and multiple sensor system for monitoring activity in a shared radio frequency band
MX2007011265A (en) Measurement request report extensions for media independent handover.
US11064391B2 (en) Remote channel selection
WO2019166880A1 (en) Wireless lan monitoring using an access point
Thangaraj Scalable Wireless LAN Traffic Monitoring and Analysis
Quiel Rodriguez Context aware self-configuring wi-fi network

Legal Events

Date Code Title Description
AK Designated states

Kind code of ref document: A2

Designated state(s): AE AG AL AM AT AU AZ BA BB BG BR BY BZ CA CH CN CO CR CU CZ DE DK DM DZ EC EE ES FI GB GD GE GH GM HR HU ID IL IN IS JP KE KG KP KR KZ LC LK LR LS LT LU LV MA MD MG MK MN MW MX MZ NO NZ OM PH PL PT RO RU SD SE SG SK SL TJ TM TN TR TT TZ UA UG US UZ VN YU ZA ZM ZW

AL Designated countries for regional patents

Kind code of ref document: A2

Designated state(s): BW GH GM KE LS MW MZ SD SL SZ TZ UG ZM ZW AM AZ BY KG KZ MD RU TJ TM AT BE BG CH CY CZ DE DK EE ES FI FR GB GR HU IE IT LU MC NL PT RO SE SI SK TR BF BJ CF CG CI CM GA GN GQ GW ML MR NE SN TD TG

121 Ep: the epo has been informed by wipo that ep was designated in this application
DFPE Request for preliminary examination filed prior to expiration of 19th month from priority date (pct application filed before 20040101)
122 Ep: pct application non-entry in european phase
NENP Non-entry into the national phase in:

Ref country code: JP

WWW Wipo information: withdrawn in national office

Country of ref document: JP